ADHESIVE QUALITIES OF CONSOLIDANTS FOR DETERIORATED WOODTOMOYASU SAKUNO, & ARNO P. SCHNIEWIND
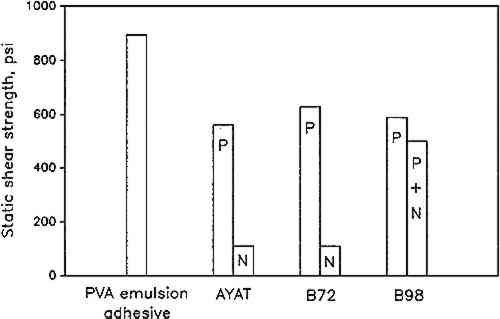
3 RESULTSVISCOSITIES OF resin consolidant solutions are shown in table 1. Values range from 10 to 360 centipoise (CPS), much less than commercial adhesives for wood, which rarely have viscosities of less than 800 and more commonly of 2,000–3,000 centipoise. 3.1 STATIC SHEAR STRENGTHExperiments had been originally designed to detect if differences in degree of deterioration from one pile to the next, or from one location within a pile to the next, might cause differences in adhesive bond strength. Statistical analysis of the data (using a general linear model because of the unequal number of replications) indicated that there were statistically significant differences due foremost to treatment, but also to pile and an interaction between pile and treatment. Location and other interactions were not significant. The data were therefore combined into average values of nine (in some cases eight) observations each and are shown in table 2. TABLE 2 Static Bond Shear Strength by Treatments and Piles The specific gravity of the outer layer of pile 12 was lowest and of pile 16 the highest. There was also evidence that the degree of deterioration was greatest in pile 12 and least in pile 16. The same ordering was found for static bond shear strength, which would be expected as wood strength is proportional to specific gravity, and wood strength is an important factor in bond strength except when there is poor adhesion. Pile 16 gave both the lowest values (B72 and AYAT in toluene) and the highest values (AYAT in ethanol and PVA emulsion adhesive). These values are a major reason for finding the interaction of treatment and pile statistically significant. The between-pile variation, which represents between-tree variation, is part of the total variability that will inevitably be encountered with a natural product such as wood. The data were therefore further combined into average values of 36 (or 35) observations, leaving only treatment effects, and are shown in table 3. Static shear strength was highest for the PVA emulsion adhesive, which should not be surprising since it is the only medium of the seven tested that had been specifically formulated as an adhesive. Next in strength, at about ⅔ the strength of the PVA emulsion adhesive, is the series 1 group of consolidants consisting of each resin with a polar solvent (acetone or ethanol). Butvar B98 with the mixture of ethanol and toluene as solvent was somewhat less strong, but Acryloid B72 and AYAT with toluene gave very little shear strength so that series 2 as a whole had much lower values than series 1. This is further illustrated in figure 4. TABLE 3 Shear Test Results by Treatments
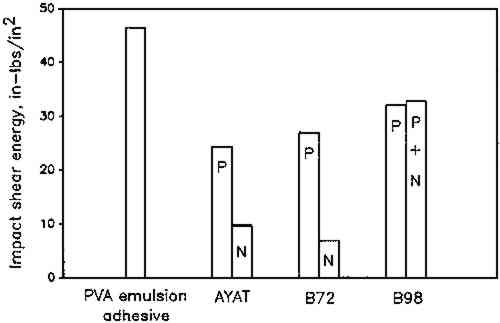
The percentage of wood failure is another indicator of adhesive bond integrity. In industrial settings, wood failure percentages of 100 are desirable, and this level has been virtually achieved with the PVA emulsion adhesive. It thus represents the maximum bond strength that could be obtained with the wood samples of this study since the strength of the bond is almost entirely controlled by the strength of the wood itself. For B72 and AYAT in toluene where shear strength was very low, 0% wood failure was obtained, while for the other systems it ranged from 16% to 28%. 3.2 IMPACT SHEAR STRENGTHThe results of the impact shear strength tests are also summarized in table 3. Results of statistical analysis were the same as for static bond strength, and values were again combined in the same manner and are listed as averages of 36 (or 35) observations. The trends for impact shear strength are much the same as for static shear tests, since the PVA emulsion adhesive gave the highest, and B72 and AYAT of series 2 the lowest values of impact energy consumed during the test, as shown in figure 5. The main difference is that B98 gave almost identical results regardless of solvent and that these results were higher than the B72 and AYAT series 1 values. This result is also reflected in the values for percentage of wood failure, since only B98 among the consolidants showed significant amounts of wood failure, while for B72 and AYAT it ranged from very little to none.
|