EVALUATION OF APPEARANCE AND FADING OF DAYLIGHT FLUORESCENT WATERCOLORSSANDRA A. CONNORS-ROWE, HANNAH R. MORRIS, & PAUL M. WHITMORE
3 LIGHTFASTNESS UNDER DIFFERENT LIGHTING CONDITIONSMany daylight fluorescent colorants are known to be sensitive to damage from light exposure. In this study, the light sensitivity of the Dr. Ph. Martin watercolors was measured to assess the appearance changes that occur during fading and the rates at which fading occurs under light sources of different spectral output. Three different lighting conditions were explored: (1) a continuous high CCT source simulating daylight, which included near-ultraviolet wavelengths; (2) the same source with the near-ultraviolet wavelengths excluded; and (3) a black light source emitting only near-ultraviolet wavelengths. Low CCT light sources were not evaluated because it is unlikely that fluorescent materials would be exhibited under such sources.
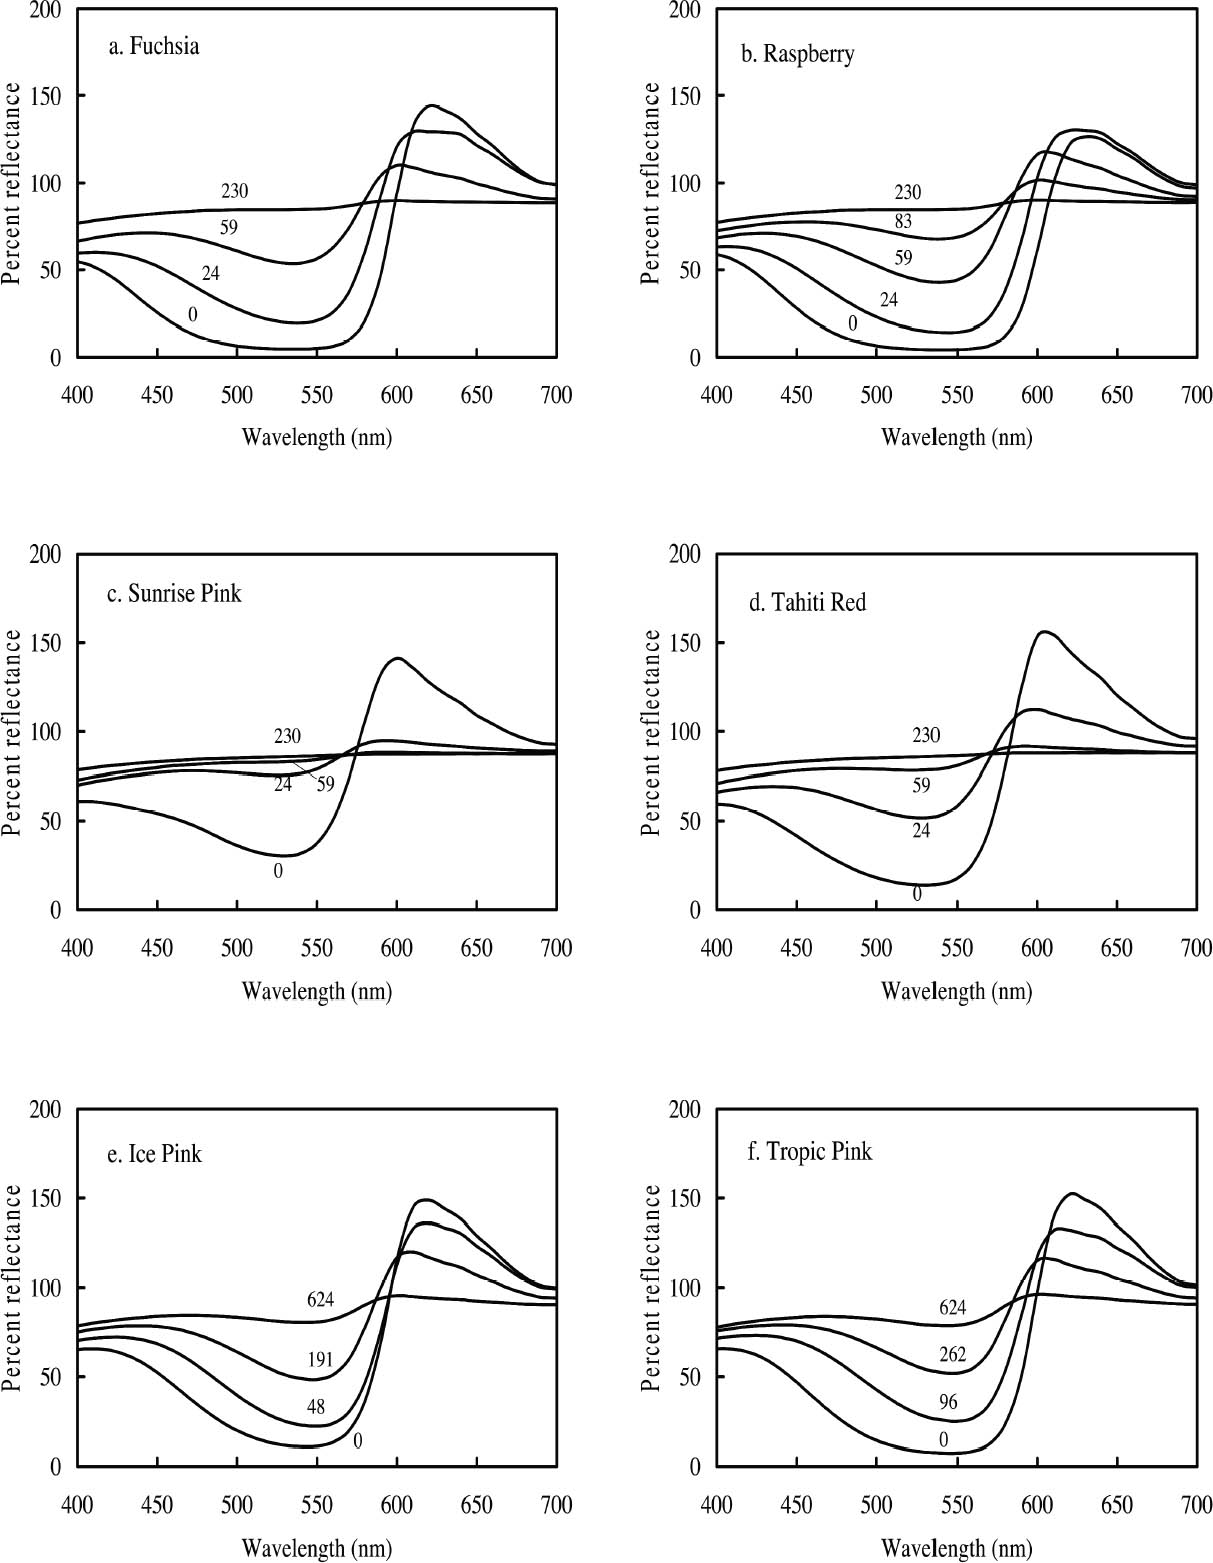
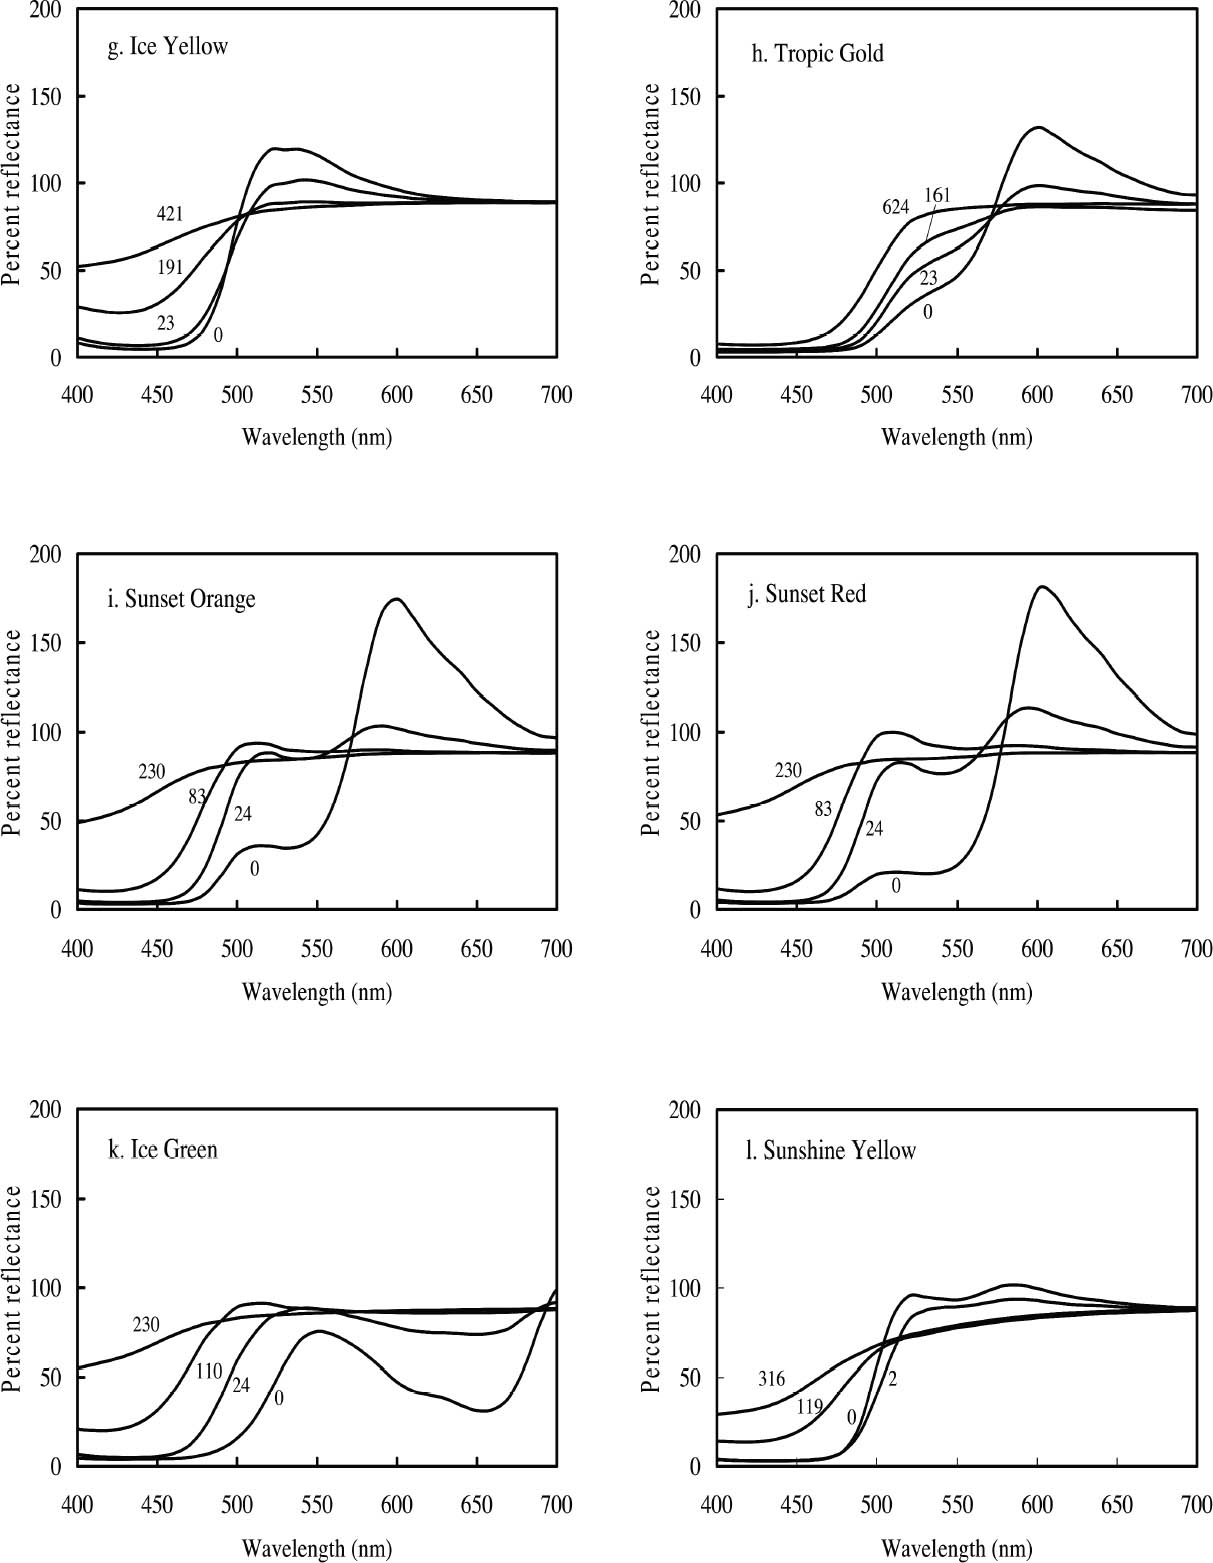
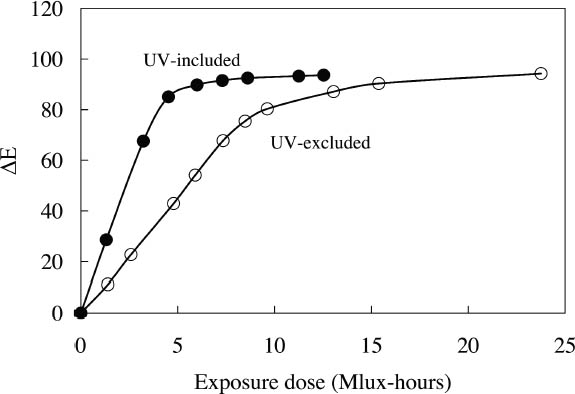
3.1 LIGHTFASTNESS UNDER DAYLIGHT CONTAINING UV3.1.1 Spectral and Appearance ChangesFigure 7 shows the reflectance spectra of the Dr. Ph. Martin watercolors at various intervals during their exposure to the output of a simulated daylight source (a xenon lamp), including near-ultraviolet wavelengths. These data show the spectral changes that occur during fading where three types of change are displayed. In 7 of the 12 watercolors (figures 7a-g) light exposure causes a gradual loss of fluorescent emission (decrease in the apparent reflectance of the most prominent reflectance peak), until in very faded samples the fluorescent emission is nearly extinguished and the reflectance reaches a value near 80%, that of the white paper support. This loss of fluorescent emission is likely to be the phenomenon that has been observed by conservators and described as the darkening of the paint from light exposure (Ellis et al. 2002; Baxter 2003). As the 7 watercolors that display this first pattern of fading lose their fluorescent appearance, they also lose their strong absorption band (in the 450–550 nm region for all watercolors except Ice Yellow, whose absorption band is between 400 nm and 500 nm). The fading of these watercolors progresses until reflectance values between 450 nm and 550 nm (400–500 nm for Ice Yellow) reach 80%, the value for the paper alone. Thus both the fluorescent emission and absorbance of the paints decrease during the light exposure: they become less luminous and lighten toward white as they fade. A different pattern of spectral change occurs during the exposure of four of the paints (Tropic Gold, Sunset Orange, Sunset Red, and Ice Green, This unusual spectral change during fading occurs in these paints because their original appearance depends on energy transfer between two fluorescing dyes in the paint, a process described above in section 2. In the unfaded paint, light is absorbed by one colorant (the donor) and emitted at around 510 nm, and the second colorant in the mixture (the acceptor) significantly absorbs that emission and re-emits it near 600 nm. Thus the paint primarily displays the fluorescent emission at 600 nm of the second dye. Prolonged light exposure interrupts this process, apparently by quickly destroying the very fugitive acceptor dye. The fading paint thus takes on the appearance of a watercolor containing only the donor dye, which emits its fluorescence at the lower 510 nm wavelength, and a pronounced shift in hue accompanies the gradual lightening of the color. The 12th watercolor included in this study, Sunshine Yellow (figure 7l), is similar to these last four paints in that it seems to contain a mixture of fluorescent colorants. However, the fading of this mixture does not seem to involve the initial complete loss of one component of the mixture. Rather, both fluorescent constituents seem to contribute emission to the reflectance spectrum, at 520 nm and at 590 nm, and light exposure causes both emission peaks to disappear essentially together. For this watercolor only, the fluorescent emission is first lost, and then the watercolor fades, seen by an increase in reflectance between 400 nm and 500 nm. In this case, even though there seems to be a mixture of colorants, the watercolor simply fades toward white without the abrupt shift in hue seen with the other mixtures. Upon visual inspection, all 12 of these watercolors eventually show a mottled and dull appearance after prolonged exposure to simulated daylight regardless of the type of change that occurs. This faded appearance helps to distinguish a light-damaged area of color from a fresh application of dilute color and may be useful when inferring the original appearance of an artwork, discussed further in section 4.2. 3.1.2 Fading RateThe fading rate of these paints was determined by calculating, from the measured reflectance spectra, the change in color as it was measured under a particular reference light source (the standard illuminant D65 was used). As the spectrum changed during fading, the difference in perceived color (Δ E) was derived using the 1976 CIE L*a*b* formula. The amount of color difference produced during the light exposure is a measure of the paint's lightfastness, and the observed fading rate was also compared to that of ISO Blue Wool Fading Standards exposed to the same light source. Table 2 shows the Δ E increase produced during the exposure of the watercolor samples and Blue Wool Standards to simulated daylight, including the near-ultraviolet wavelengths in the exposure. Most of these paints were very sensitive to light exposure, with a lightfastness less than or comparable to Blue Wool 1 or 2 in this exposure test. Only Ice Pink, Tropic Pink, and Ice Green had moderate light sensitivity, fading at rates comparable to Blue Wool 3. Table 2 also denotes when a hue shift experienced by a specific watercolor is responsible for the calculated color change (Δ E). The Δ E values for all other watercolors resulted from more typical fading behavior (i.e., lightening toward white). 3.2 PROTECTION GAINED FROM UV FILTRATIONRemoval of UV wavelengths from exhibition lighting conditions is a common museum practice designed to slow the rate of appearance change in
It is important to note that those watercolors showing the greatest preservation benefit from the removal of UV radiation are the same watercolors showing the least amount of appearance change from the removal of UV wavelengths (see section 2.3). In other words, for some of the watercolors studied, removing UV will slow their fading rate significantly with little perceptible change in appearance. 3.3 LIGHTFASTNESS UNDER A BLACK LIGHT SOURCE3.3.1 Spectral and Appearance ChangesOccasionally daylight fluorescent colorants will be exhibited under UV or black light alone. Therefore, the light sensitivity of the Dr. Ph. Martin watercolors when exposed to black light was also considered. The spectral changes produced during fading under these conditions were similar to those found when exposed to simulated daylight sources. Six of the 12 watercolors (Fuchsia, Raspberry, Sunrise Pink, Tahiti Red, Ice Pink and Tropic Pink)
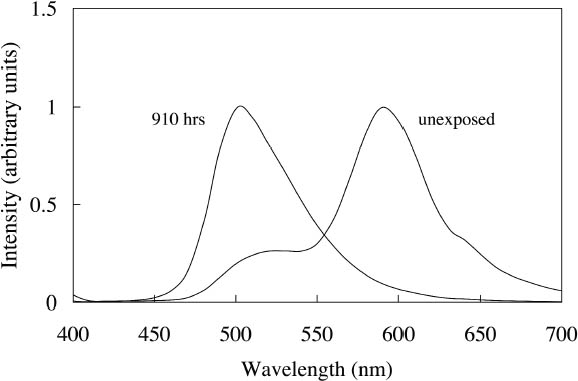
Ice Yellow and Sunshine Yellow experienced a slight shift in their fluorescent emission peaks near 500 nm toward shorter wavelengths as they faded. This shift can be accounted for by the change in colorant concentration experienced by the watercolors as they fade. As explained in section 2.2, the position of the fluorescent emission peak shifts toward shorter wavelengths with a decrease in concentration of the colorant, a change one expects as the colorant fades toward white. The last four watercolors (Tropic Gold, Sunset Orange, Sunset Red, and Ice Green) exhibited unexpected fading behavior from exposure to a black light source. The paints still experienced a loss of fluorescent emission at the longer wavelength emission peak, along with an increase in intensity of the shorter wavelength emission peak. This behavior was seen in the fading of dye mixtures in section 3.1.1, where the long wavelength emission peak was lost from destruction of the acceptor dye that disrupts the energy transfer. In this case, the emission peak at shorter wavelengths did not continue to fade further from black light exposure, as they had when exposed to simulated daylight. It seems that the dye emitting at shorter wavelengths (510 nm) is not rapidly degraded by UV. This behavior makes the hue shift experienced by Tropic Gold, Sunset Orange, and Sunset Red even more prominent. The spectra of light emitted from Sunset Red under black light illumination, before and after 910 hours of exposure, are shown in figure 9 as an example. The hue shifted from orangered to green and remained green throughout the remainder of the fading experiment. As a result, distinguishing among the appearance of Tropic Gold, Sunset Orange, Sunset Red, and other watercolors that exhibit this 510 nm emission peak (Ice Green, Ice Yellow, and Sunshine Yellow) when illuminated with black light would become very difficult after only a short exposure to those conditions.
3.3.2 Rate of Color ChangesThe fading rates of these watercolors were determined by calculating the color change (ΔE) as it would appear under black light illumination. The ΔE values for each watercolor are listed in table 4, and a description of the measurement and calculation used to determine ΔE values is given in the appendix below. These paints show significant light sensitivity under black light illumination. Many show a large change in appearance (ΔE > 10) after only a brief exposure. There is some difference in the light sensitivity of these watercolors when exposed to UV alone compared with results from their exposure to a daylight source (see table 2). Some of the watercolors (Tropic Gold, Tahiti Red, and Sunset Orange) experienced an increase in emission as a result of black light exposure. One possible explanation for this behavior is the presence of a nonfluorescent toner in the colorant that contributes only chromatic color to
Figure 9 shows the spectral change experienced by Sunset Red, which occurs rapidly under black light conditions. The same hue shift from red to green fluorescent emission occurs for the Sunset Orange and Tropic Gold watercolors. Because of this prominent shift, the ΔE values (when viewed under black lights) for Tropic Gold, Sunset Red, and Sunset Orange following black light exposure are relatively high (see table 4), indicating a significant change in appearance. This shift in peak emission wavelength was also seen under simulated daylight exposure. However, under those conditions the short-wavelength emission peak (510 nm) continued to degrade, while under black light conditions the green fluorescent emission peak remained intense through the duration of the fading experiment. |