EVALUATION OF APPEARANCE AND FADING OF DAYLIGHT FLUORESCENT WATERCOLORSSANDRA A. CONNORS-ROWE, HANNAH R. MORRIS, & PAUL M. WHITMORE
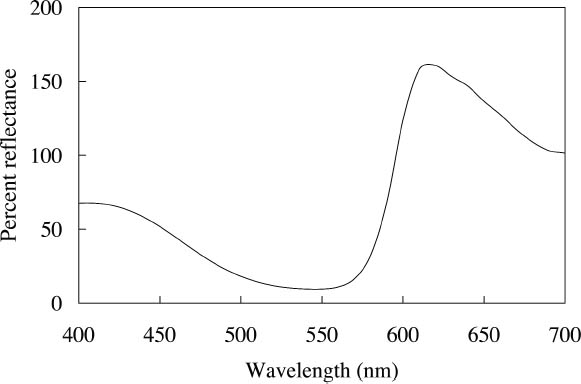
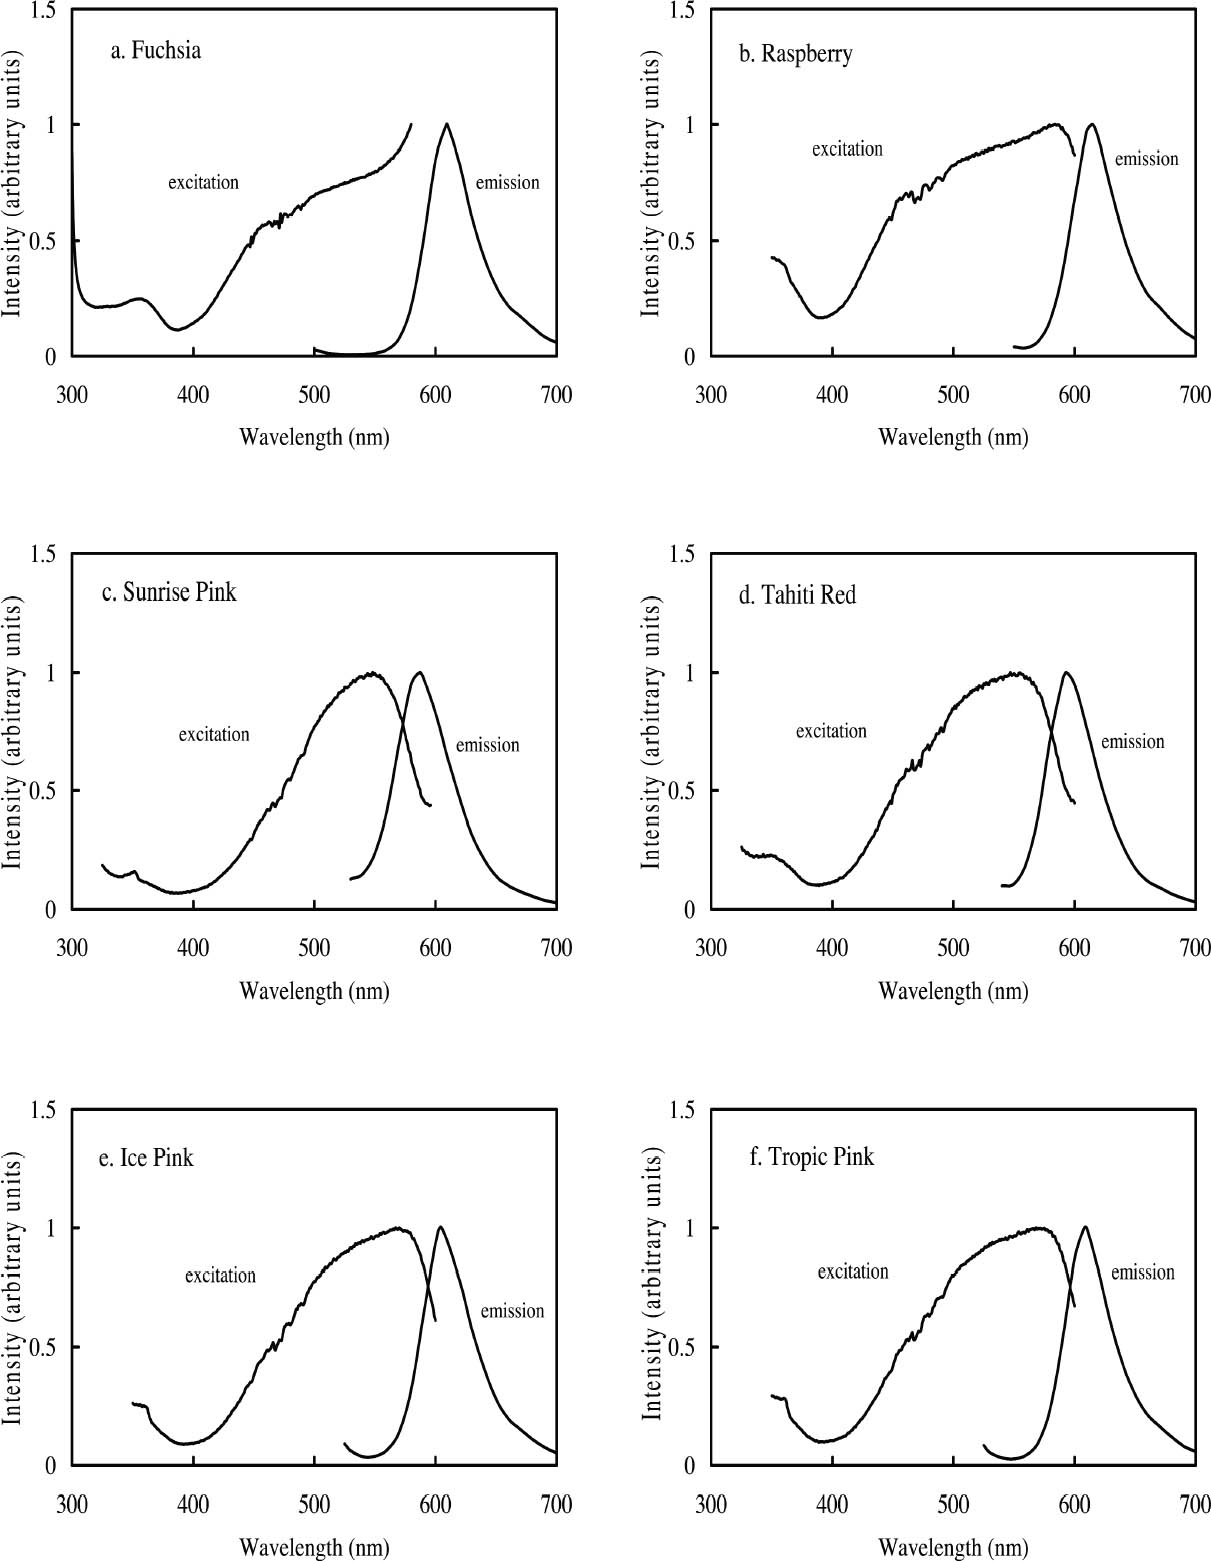
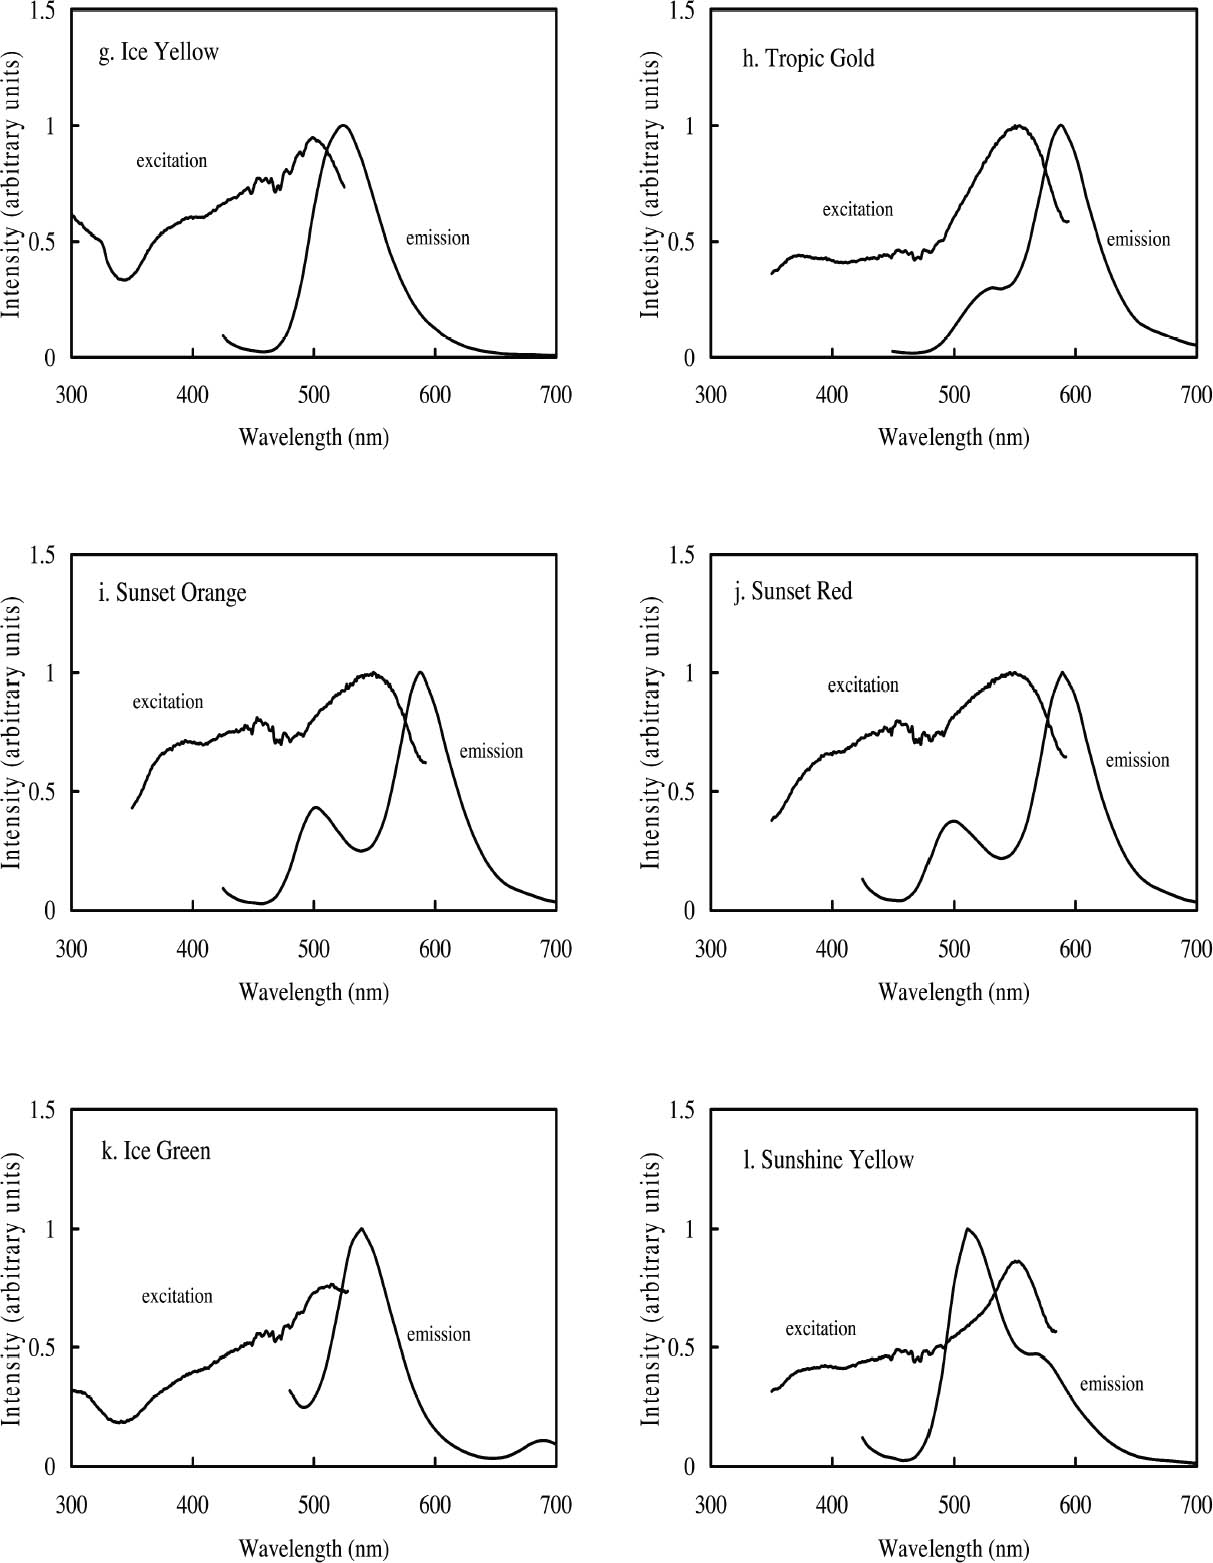
2 FLUORESCENT COLORANTS AND THEIR APPEARANCE2.1 FLUORESCENT APPEARANCEAs the name indicates, fluorescent colorants derive their unique appearance from their ability to strongly fluoresce, that is, to absorb light at one wavelength and to re-emit it at longer wavelengths. The appearance of a fluorescent colorant is thus the additive mixture of directly reflected light and the fluorescent emission from other absorbed wavelengths. A reflectance spectrum of a typical fluorescent colorant is shown in figure 1 and displays the wavelength regions of low reflectance as well as the very high measured intensity due to the fluorescent emission. The addition of fluorescent emission causes the colorant's measured reflectance to be greater than the 100% limit of totally reflected incident light, and this enhanced reflectance creates the characteristic luminous appearance of a fluorescent color. In many cases the added fluorescent emission occurs at the edge of the colorant's absorption band, a situation that increases the steepness and height of the transition from low to high reflectance. This condition effectively increases the chroma of the color. These attributes—the apparent luminosity and the high chroma—are the distinctive features of fluorescent colors. The fluorescent watercolors examined in this study are examples of so-called daylight fluorescent colorants. Unlike familiar art materials such as madder lake (de la Rie 1982a), Indian yellow (Baer et. al 1986), or damar (de la Rie 1982b), which fluoresce only when illuminated with ultraviolet wave-lengths, daylight fluorescent colorants have been developed to fluoresce from exposure to visible light. Shown in figure 2 are the excitation spectra (i.e., the spectrum of light that will excite the fluorescent emission) for the fluorescent watercolors, applied on paper, included in this study. Also shown in this figure are the spectra of the fluorescent emission for these watercolors. Both excitation and emission spectra were measured using a fluorimeter (see table 5 for experimental details). All the watercolors show fluorescent excitation in the visible region between 400 and 600 nm, and many show additional fluorescent excitation in the near-ultraviolet wavelength region (350–400 nm).
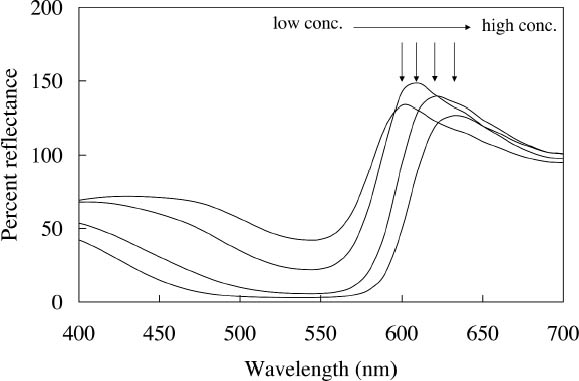
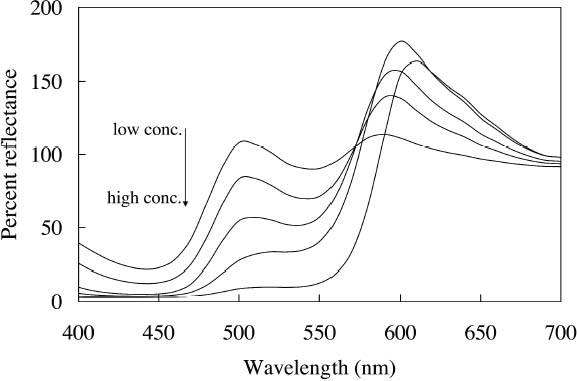
The multiple peaks in the fluorescent emission spectra of a number of watercolors (namely, Tropic Gold, Sunset Orange, Sunset Red, Ice Green, and Sunshine Yellow) are characteristic of mixtures of fluorescent dyes. These mixtures are formulated in a very specific way to take advantage of an interaction of the fluorescence between the components, in which the emission of one fluorescent dye is absorbed by a second dye, causing an increase in emission of the second dye. This so-called energy transfer from one dye to another may broaden, shift, and amplify the emission region of the fluorescent paint (Billmeyer and Hepfinger 1983; Christie 1993). 2.2 APPEARANCE CHANGES WITH WATERCOLOR CONCENTRATIONDaylight fluorescent watercolors are typically applied as washes, and their appearance is derived mainly from the absorption and fluorescence behavior, with very little optical scattering. Like paint glazes, then, fluorescent watercolors can experience shifts in hue at high concentration, as the absorption bands extend to a wider wavelength region in the reflectance spectrum (Johnston-Feller and Bailie 1982; Whitmore and Bailie 1997). In addition to the reflectance changes produced from very high absorption levels, fluorescent colorants may also fluoresce differently at high concentrations. Some fluorescence can be self-quenched—that is, a portion of the fluorescent emission can be absorbed by the colorant. Not only does self-quenching reduce the intensity of the fluorescent emission; it also leads to a shift of the peak fluorescence wavelength. An example of this quenching effect is the behavior of the Raspberry watercolor, whose reflectance spectra (measured using a xenon light source) of applications at different
Concentration changes also have a profound effect on the reflectance spectra of those watercolors that experience energy transfer between their component dyes. An example is the Sunset Red watercolor, whose reflectance spectra (measured with the same xenon illumination described above) at different concentrations are shown in figure 4. At high concentrations the reflectance is dominated by the fluorescent emission at 600 nm from one of the two fluorescing components. As the concentration decreases, the energy transfer between the dyes becomes less efficient and the emission at 600 nm is greatly reduced, while the emission at 510 nm, from the other component, becomes apparent. For some watercolors, such as Sunshine Yellow, the relative contributions of the two fluorescing components are reversed upon dilution. This watercolor can shift from a reddish yellow when concentrated, with the dominant fluorescent emission at 600 nm, to a greenish yellow when dilute, when the 510 nm fluorescent emission dominates and the energy transfer to the 600 nm emitter almost disappears. These complex color changes with varied colorant concentration are obviously important to control in achieving the desired color effect during creation of a painting. These color changes may also occur as a fluorescent watercolor is degraded upon light exposure. The color changes that occur with fading can involve these same hue shifts accompanying dilute applications, increases or decreases in fluorescent emission, and the gradual bleaching of color to a lighter value. Such color changes can dramatically alter the original appearance of a work. These changes will also pose formidable challenges in color matching should light-induced fading affect the complicated interplay of chromatic color (from selectively absorbed wavelengths) and luminous color (from fluorescent emission) or disrupt the energy transfer in colorant mixtures and change the hue. These issues will be discussed at more length in section 4 below.
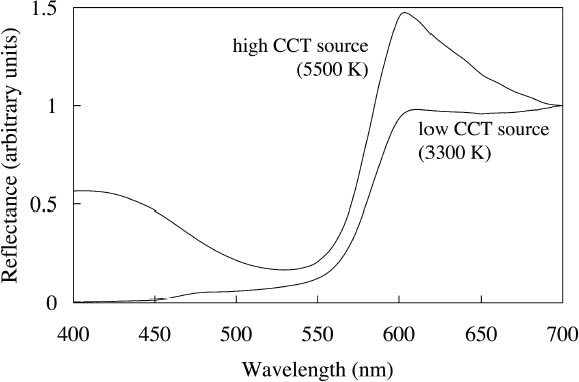
2.3 APPEARANCE UNDER DIFFERENT LIGHTING CONDITIONSThe fluorescent emission of such watercolors also affects the appearance of an application when viewed under different light sources in ways that may not be intuitive: changes in the spectral output of the illuminating source in one wavelength region can cause measurable changes in the reflectance at other parts of the spectrum. For example, one expects a color to look more yellow when viewing it under a low CCT source, such as an incandescent lamp. This illumination provides very low intensity at the blue end of the spectrum, so the spectrum of light reflected from an object under this source is also reduced at the blue wavelengths. A fluorescent watercolor under such a yellow source, however, not Conversely, illumination with lighting that has greater intensities at wavelengths that excite fluorescent emission will enhance the fluorescent appearance. While it is difficult to envision modified gallery lighting richer in blue-green wavelengths without many other color-rendering difficulties, the watercolors having substantial excitation in the near-ultraviolet region (noted above in section 2.1) would have their fluorescent appearance enhanced by supplementary illumination with near-ultraviolet black light sources. These watercolors may also have their fluorescent appearance enhanced by display under black lights alone (Tsang et al. 2004), in which case their appearance will be defined by their fluorescent emission spectrum only (since there is no perceptible reflected visible light under those conditions). Such display is likely to increase light-induced damage to the colorants, and it is more typical to consider restricting ultraviolet exposure to preserve the colors. The latter preservation strategy can usually be implemented with little concern about a negative impact on the appearance of an artifact. Yet for colorants exhibiting fluorescence excited by ultraviolet wavelengths, such a change in the lighting environment could affect the appearance of the object, reducing its chroma and luminosity, the key attributes that make it appear fluorescent.
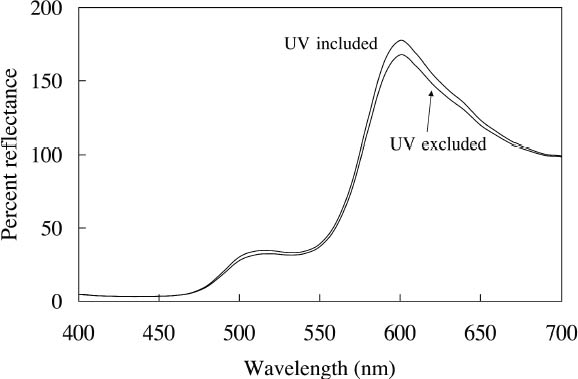
Because reducing ultraviolet exposure is an important preservation measure for many materials, including fluorescent colorants, it is critical to determine whether such a step would have an unacceptably large impact on the appearance of fluorescent watercolors. The difference in appearance for the Dr. Ph. Martin Radiant Concentrated watercolors when ultraviolet wavelengths are excluded from the illumination source has been measured, using a reflectance spectrometer in which the UV content of the probe beam (from a xenon lamp) could be either included or excluded. A typical result (in this case for Sunset Orange) is shown in figure 6, in which the prominent fluorescent emission peak at 600 nm is reduced only slightly when the ultraviolet wavelengths are excluded. This small (9.9%) decrease in total reflectance causes only a very small (2.9 Δ E units) change in the perceived color of this watercolor. Such a small change in fluorescent emission is reasonable because the excitation spectrum for this watercolor shows that the majority of fluorescent excitation occurs between 400 nm and 600 nm, with a relatively small amount of excitation from near-ultraviolet wavelengths. As shown in table 1, most of these daylight fluorescent watercolors
|
