CHARACTERIZATION BY FTIR OF THE EFFECT OF LEAD WHITE ON SOME PROPERTIES OF PROTEINACEOUS BINDING MEDIASILVIA A. CENTENO, MARCELO I. GUZMAN, AKIKO YAMAZAKIKLEPS, & CARLOS O. DELLA V�DOVA
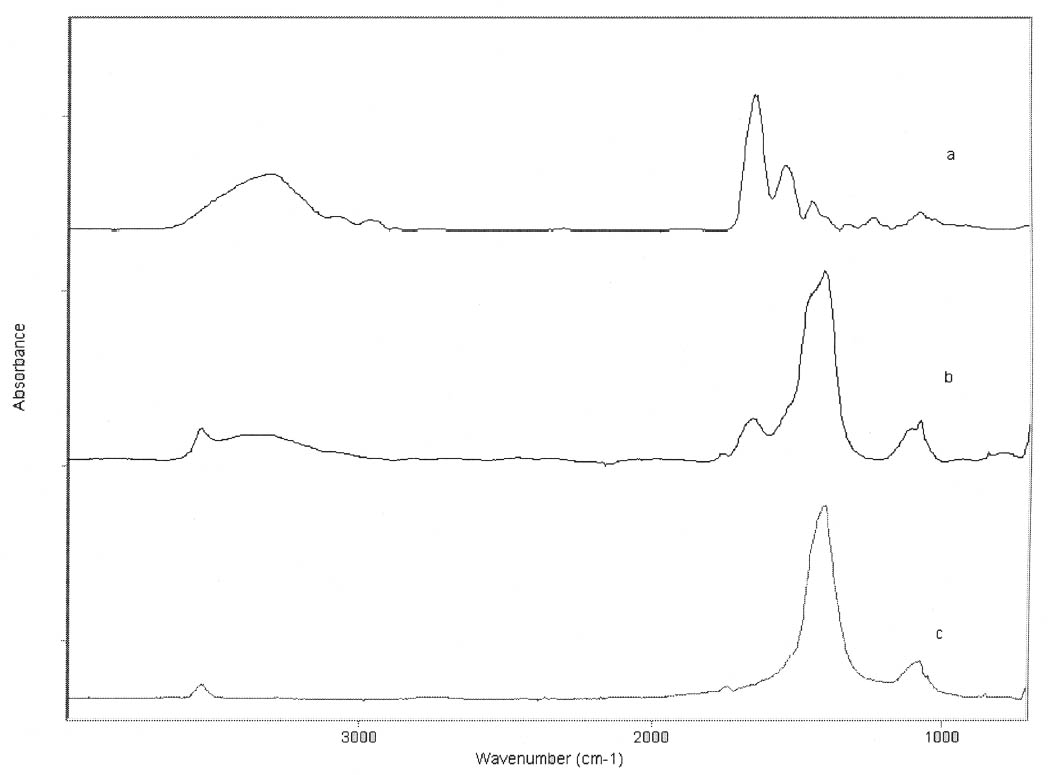
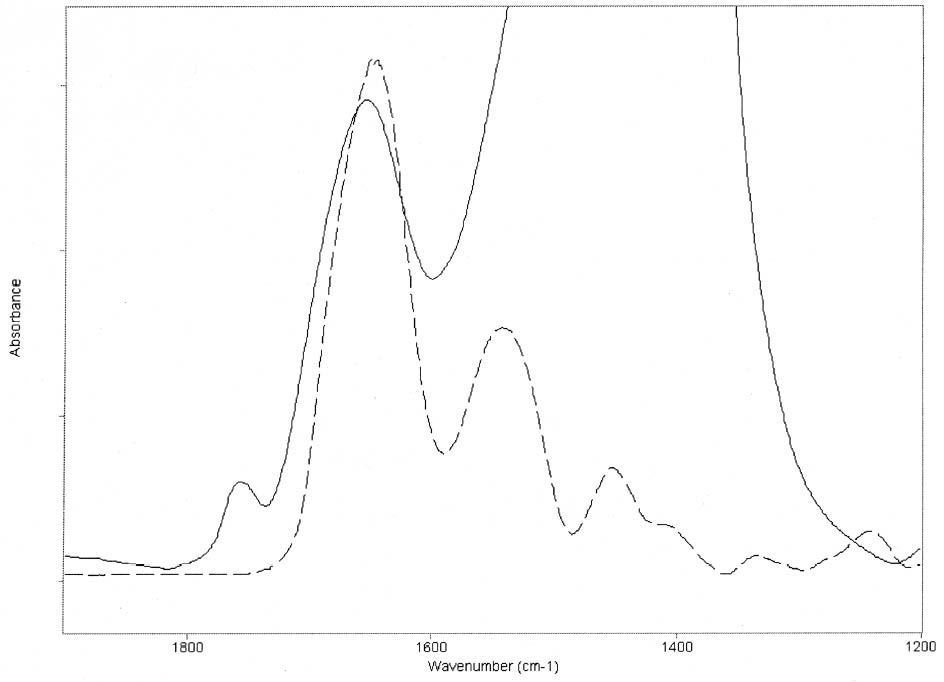
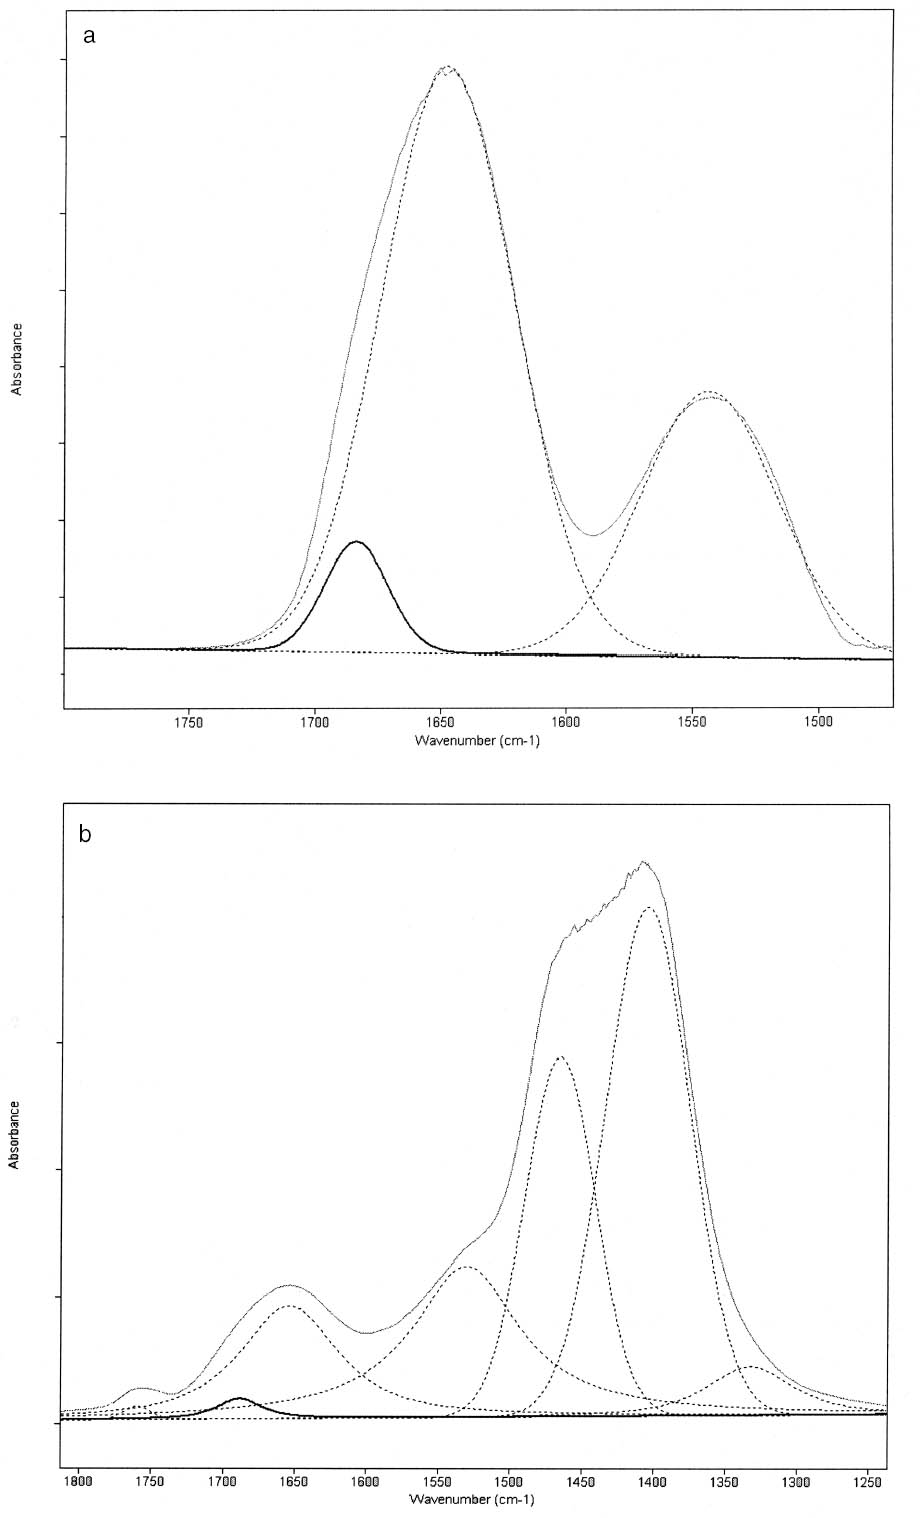
3 RESULTSThe FTIR spectra obtained for pure gelatin, glair, rabbit skin glue, and bone glue present the typical features of proteinaceous materials. The spectrum corresponding to a pure gelatin sample in shown in figure 1a. The amide I band region (~1655 cm-1) consists of amide carbonyl C=O stretching with some contribution of CN stretching and CCN deformation. The amide II (~1550 cm-1) band involves both C-N stretching and C-N-H in plane bending (Lin-Vien et al. 1991; Bandekar 1992). Of the different bands originating from the peptide linkage, only the amide I band has proved to contain significant information about the protein secondary structure. Generally, α-helices absorb in the range 1660–1650 cm-1, β-sheets in the range 1640–1620 cm-1 and near 1675 cm-1, β-turns in the range 1695–1660 cm-1, unordered structures and α-helices 1650–1640 cm-1 (Krimm and Bandekar 1986; The FTIR spectrum of the basic lead carbonate 2PbCO3•Pb(OH)2 (fig. 1c) has been fully assigned (White 1974). In the spectra of the lead white–binder mixtures, features corresponding to the lead white pigment overlap those of the pure binder, particularly the ν3 CO3-2 mode at ~1400cm-1 that partially overlaps the amide II band of the protein, so Fourier self-deconvolution, second-derivative calculations, and curve fitting were used to determine the exact peak positions. The spectrum corresponding to the gelatin–lead white mixture is shown in figure 1b. Table 1 presents a comparison of the amide I and II groups maxima for the pure binders and their mixtures with lead white conditioned at 20�C and 55% RH. The amide I maxima for the mixtures shift toward higher wavenumbers, while the amide II maxima shift toward lower wavenumbers with respect to the values observed for the pure binders. Views of the spectra of pure gelatin and its mixture with lead white showing the 1900–1200 cm-1 range in detail are shown in figure 2. Peaks obtained from the curve fitting on the amide I–amide II region are shown for gelatin and the gelatin–lead white mixture in figures 3a and 3b. These results were found to be completely reproducible and independent of the length of exposure to the infrared (IR) radiation during the measurements. Upon Gaussian–Lorentzian fitting, a minor peak component at 1683 cm-1 was obtained for pure gelatin (see fig. 3a). This maximum shifts to 1688 cm-1 in the mixture with lead white (see fig. 3b). The area of this peak relative to the area of the amide I band increases by a factor of 10 for the mixture with lead white with respect to the value obtained for the pure binder. When two other sets of samples were conditioned at 70% RH and 90% RH, respectively, it was found that the amide I maxima progressively shift to lower
The spectrum of the gelatin–lead white mixture originally conditioned at 20�C and 90% RH was measured again after five days of exposure to the laboratory environment (45–50% RH), and it was observed that the maxima for the amide I and amide II groups had shifted to higher and lower wavenumbers respectively (1656 and 1530 cm-1). The FTIR spectrum of pure PbO does not present any bands in the 1700–1500 cm-1 range (not shown). For the PbO-protein mixtures studied, the amide I maxima values also shift to higher wavenumbers, while the amide II maxima remain within �3 cm-1, with respect to the values obtained for the pure binders (shown in fig. 5 for gelatin and gelatin-massi-cot). No observations on the mechanical properties of massicot-containing paint on works of art have been reported in the literature, to our knowledge. |