FINDING SUBSTITUTE SURFACTANTS FOR SYNPERONIC NJOHN A. FIELDS, ANDREW WINGHAM, FRANCES HARTOG, & VINCENT DANIELS
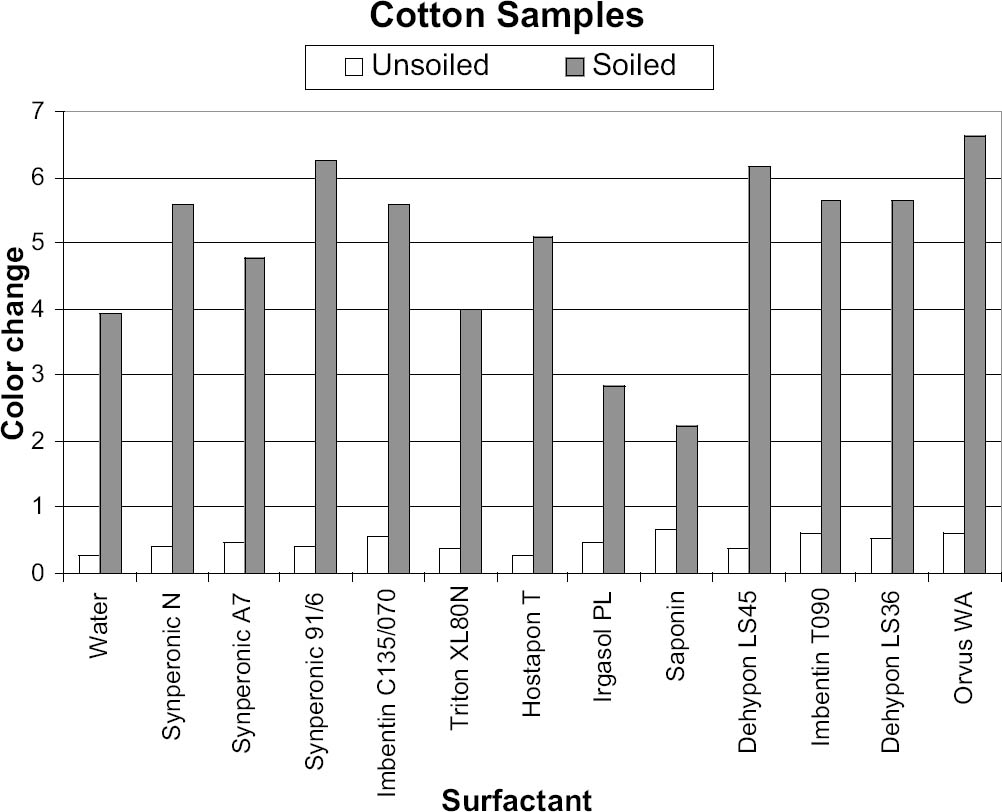
6 RESULTS FROM PHASE 16.1 CONDUCTIVITYThe conductivity behavior of solution samples obtained during the cleaning of the model textiles was similar whether wool or cotton was being washed. The conductivity of samples from nonionic cleaning was low-ranging from 7.9 to 38.4 μS, and showed a gradual decrease during rinsing. The two anionic surfactants gave higher conductivity readings at around 185 μS, which similarly decreased on rinsing. 6.2 pHThe pH readings ranged from 4.03 to 7.25; thus some readings fell outside the range expected for the washing of cotton, pH 5.5–8.0 (BSI 2002) and wool, pH 5.0–7.0 (Timar-Balazsy and Eastop 1998). Triton XL80N and Synperonic N consistently produced the lowest pH solutions. Triton XL80N samples varied from 4.03 to 6.36, while Synperonic N samples varied between 4.04 and 6.46. Otherwise the pH readings fell within the acceptable limits. 6.3 COLORThe color change (ΔE) before and after washing was calculated using the formula
The results were transferred to two graphs for initial analysis, with each graph (figs. 5, 6) representing a particular fabric type. These graphs were useful, as they gave a direct indication of the cleaning ability of each surfactant, with the gray columns representing the soil liberation from the presoiled areas. The white column on figures 5 and 6 represents soil redeposition to the clean area, but this finding was only confirmed by reviewing the original data. The positive-negative nature of the ΔE value is lost when the root mean squared formula is applied. In all instances the values for color change of the soiled areas were opposite in sign to those of the unsoiled areas, representing soiling of the clean side through redeposition. In all cases the clean area of textile became darker due to redeposited soiling, while the dirty area became cleaner. |