THE INFLUENCE OF CONSERVATION TREATMENTS AND ENVIRONMENTAL STORAGE FACTORS ON CORROSION OF COPPER ALLOYS IN THE ANCIENT ATHENIAN AGORAALICE BOCCIA PATERAKIS
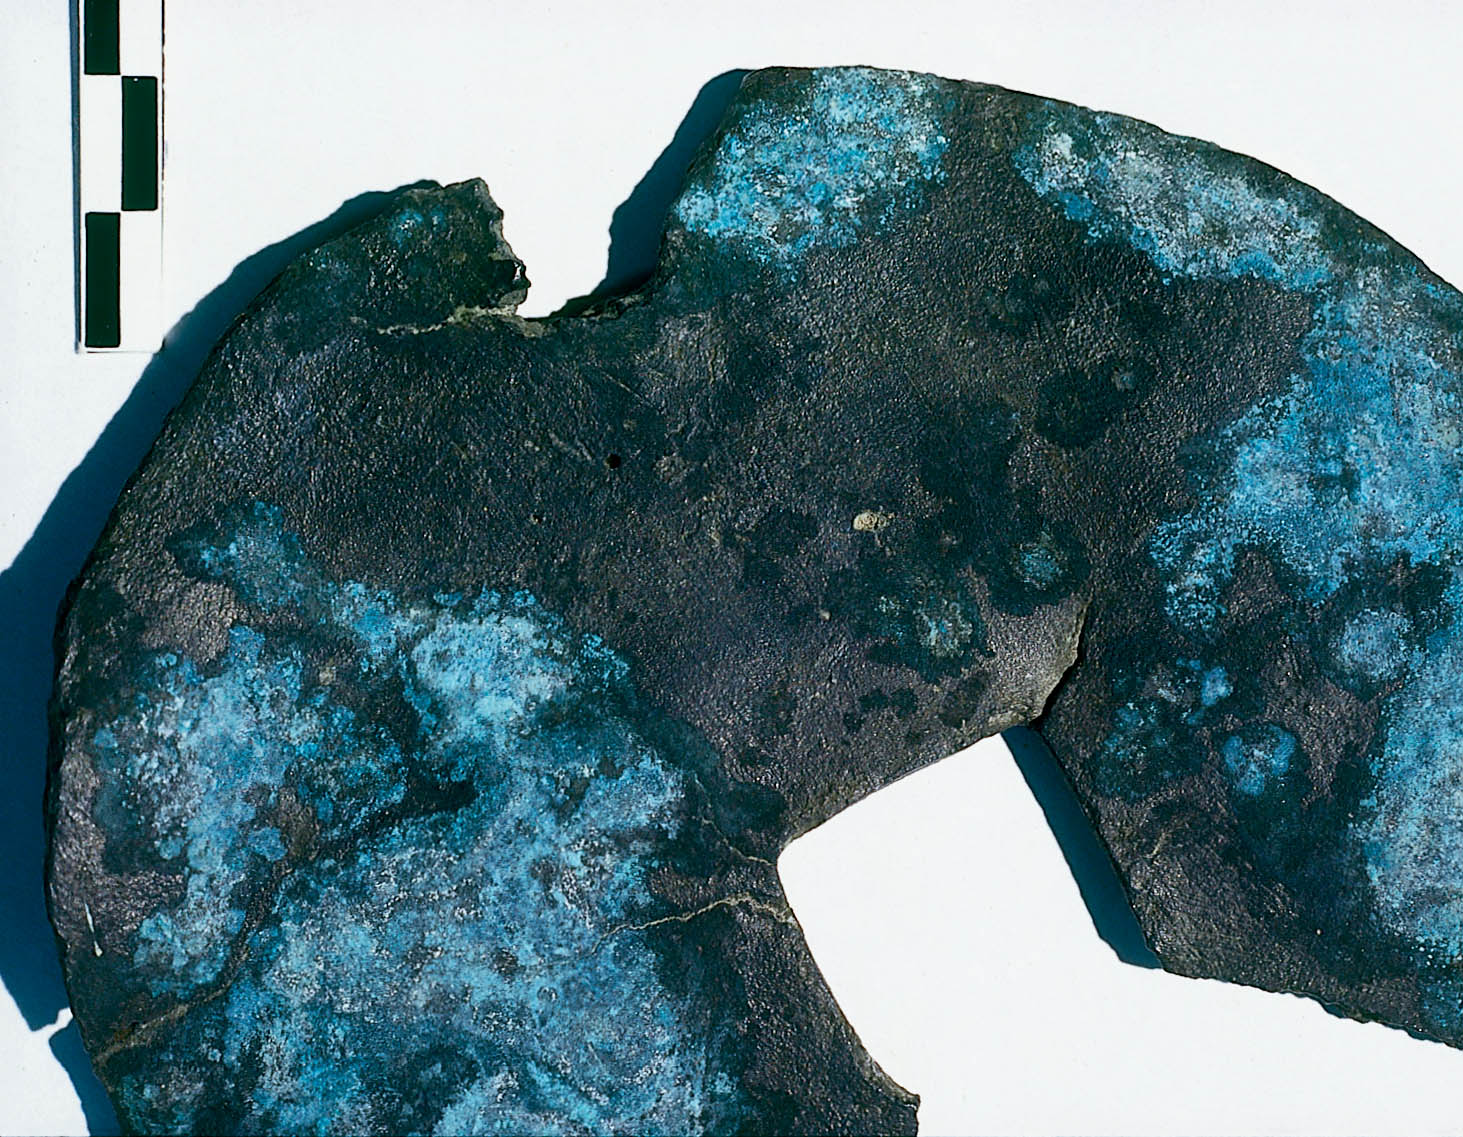
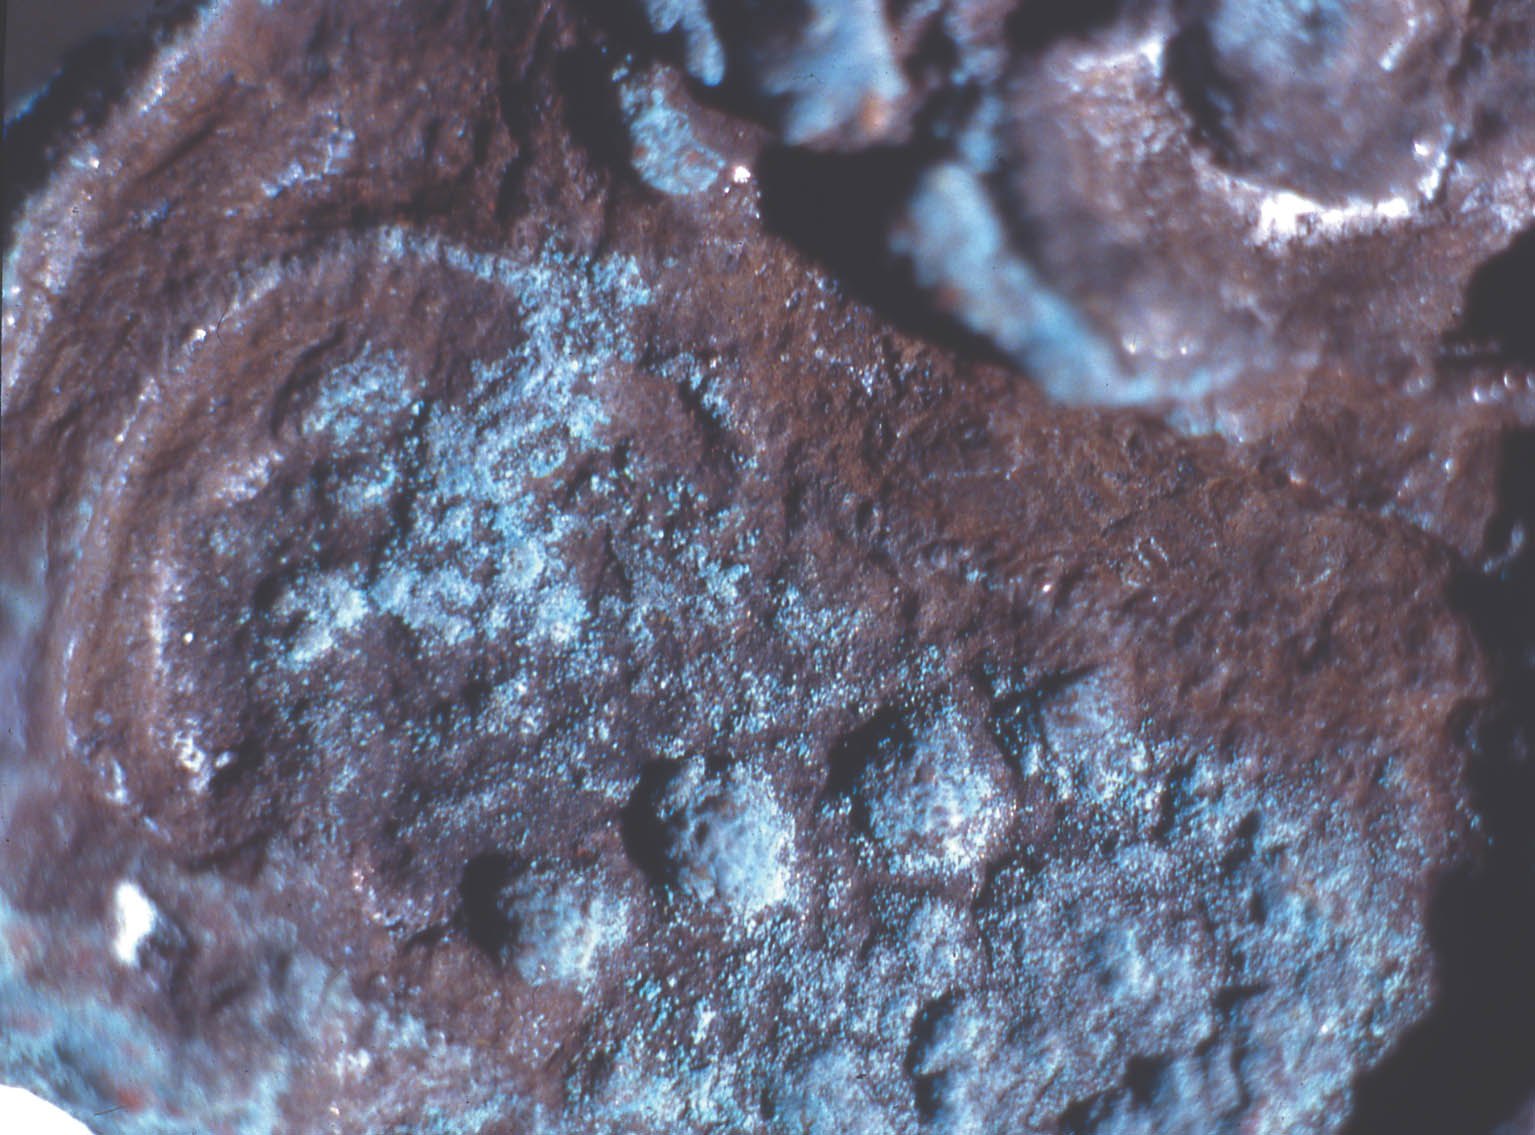
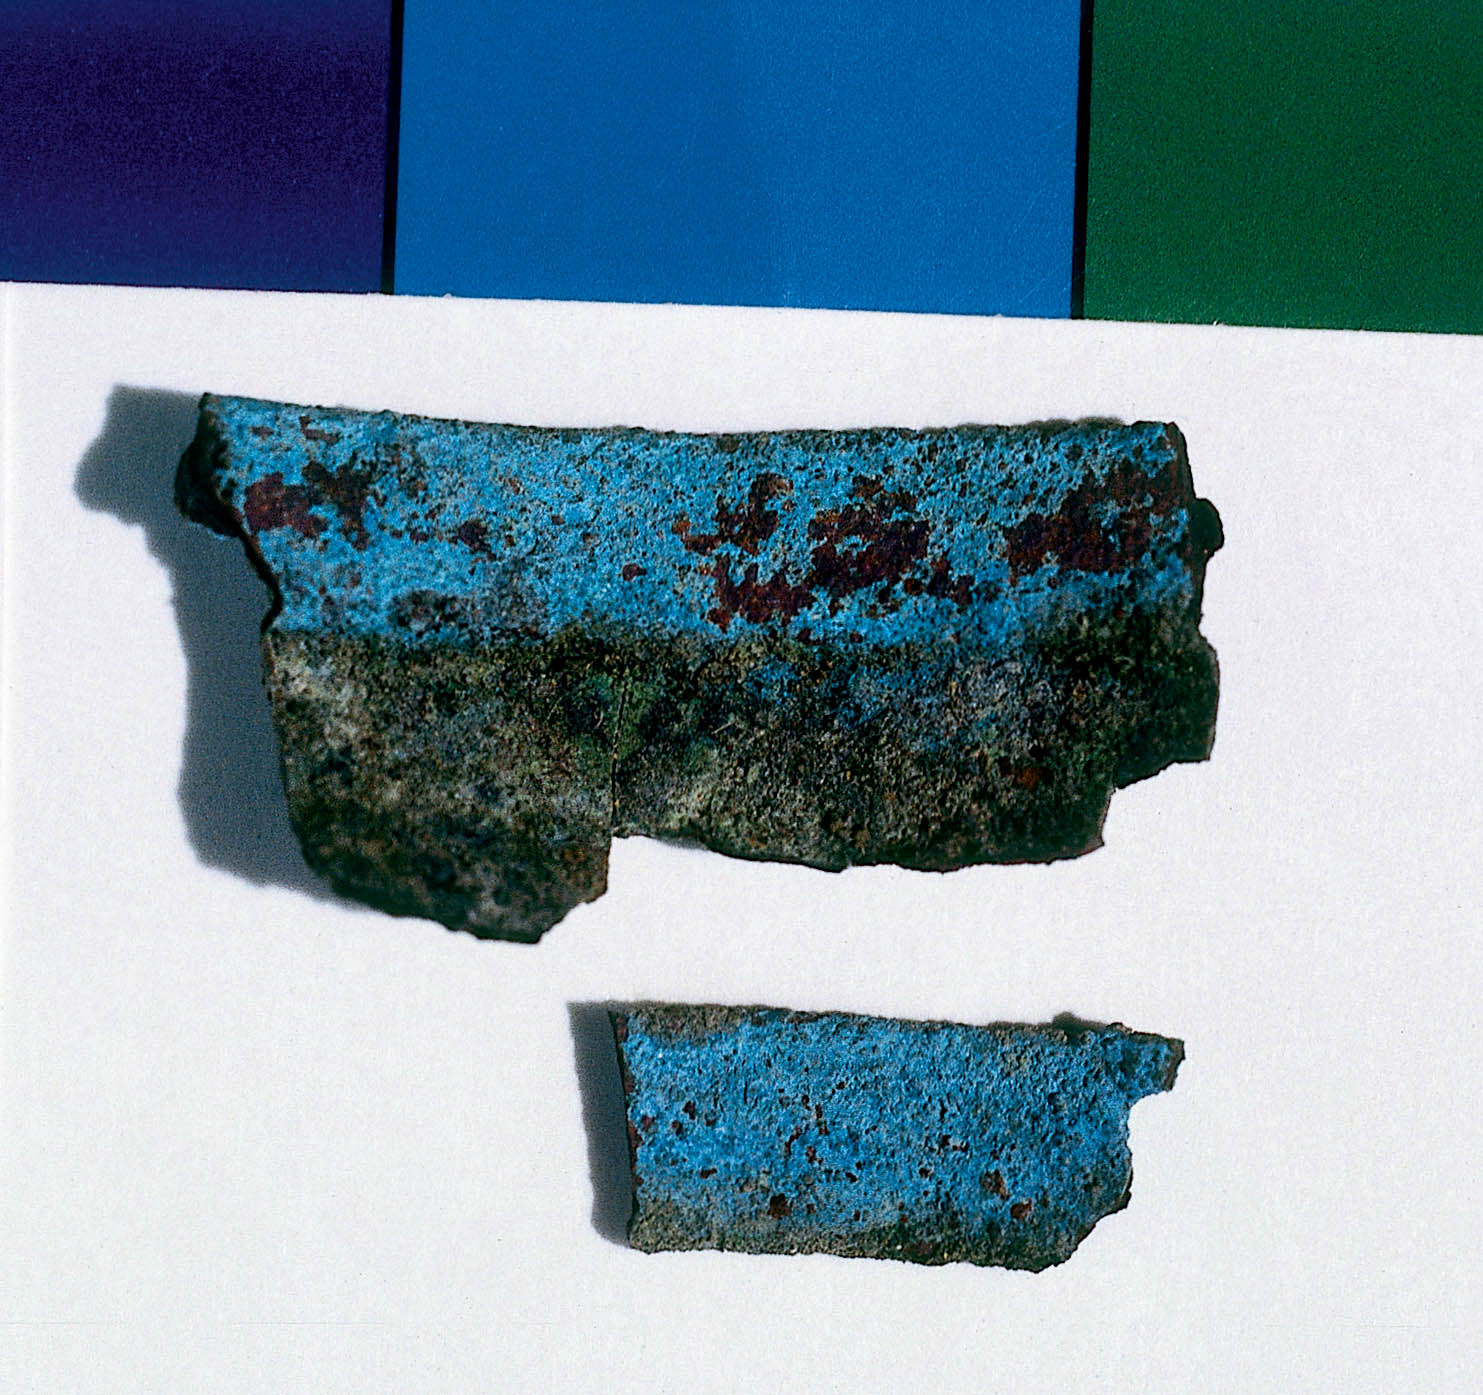
2 ANALYSIS OF CORROSION PRODUCTSAnalytical means in addition to those used in 1998 were required in order to identify the corrosion compounds. Analysis of the turquoise blue, blue, dark brown, and white corrosion products was carried out by XRD, FTIR, IC, and SEM-EDS in 1999. 2.1 ANALYTICAL TECHNIQUESFor powder XRD, a Debye-Scherrer camera was used, which allows the analysis of samples as small as 1 �g. Analysis was undertaken using Cu (alpha) radiation produced from an x-ray tube operating at 40 keV and 40 mA. A Phillips PW1120/90 generator was used. The samples were ground and adhered to a gelatin strip by wetting the end in distilled water and brushing it over the samples. FTIR characterizes the vibrational transitions of a material. It complements XRD in that it can be used for amorphous as well as crystalline materials. The use of a beam condenser and diamond cell allows analysis of sample sizes similar to those used for powder XRD. A Spectratech Sample Plan diamond cell with a 4x beam condensor on a Nicolet Ion chromatography is a modification of liquid chromatography permitting simultaneous determination of many anions and cations in solution, including acetate. Analysis was undertaken with a Dionex DX300 system using an AS12A column with 2.7 mM sodium carbonate and 0.3 mM sodium bicar-bonate eluant for anions and a CS12 column with 20 mM methane disulfonic acid eluant for cations. SEM-EDS can generate elemental analysis from extremely small samples (1 � diameter). It can be sensitive and quantitative for all elements except boron and hydrogen. The samples were pressed onto a conductive carbon pad and analyzed uncoated. The very small sample size and carbon pad allowed qualitative analysis without coating. A Joel 840 SEM with Link analyzer system was used for this work. The accelerating voltage was 25 kV and the current was 1 nA. 2.2 CORROSION SAMPLED FROM COPPER ALLOY OBJECTSThe objects sampled for corrosion and a description of this corrosion are presented in table 1. The objects from which samples 1, 2, 3, 4, 5, and 7 were removed had been chemically cleaned. Although the cleaning method used on these objects was not recorded, electrochemical reduction with zinc and sodium hydroxide is likely, based on the resulting dark, powdery, reduced corrosion (see sec. 3.3). Dark brown corrosion underlies the blue corrosion on samples 1, 2, 3, 4, and 5. White crystals coexist with the blue corrosion in varying quantities (fig. 1, see page 257). The dark brown corrosion (sample 7) consists of a soft powder that was easily removed from the surface (fig. 2, see page 258). The blue corrosion associated with it was also easily removed with a scalpel. The turquoise blue corrosion (sample 6) formed on top of malachite and cuprite of the completely mineralized bowl. With these other corrosion products, the turquoise blue corrosion forms a crust that is friable and easily flakes off, leaving a smooth surface underneath. The blue is intimately bound with the underlying corrosion and could not be sampled without removing the substrate. Although the bowl does not appear to have been chemically cleaned, it may have been treated with sodium sesquicarbonate (see sec. 3.1.2.4) (fig. 3, see page 259).
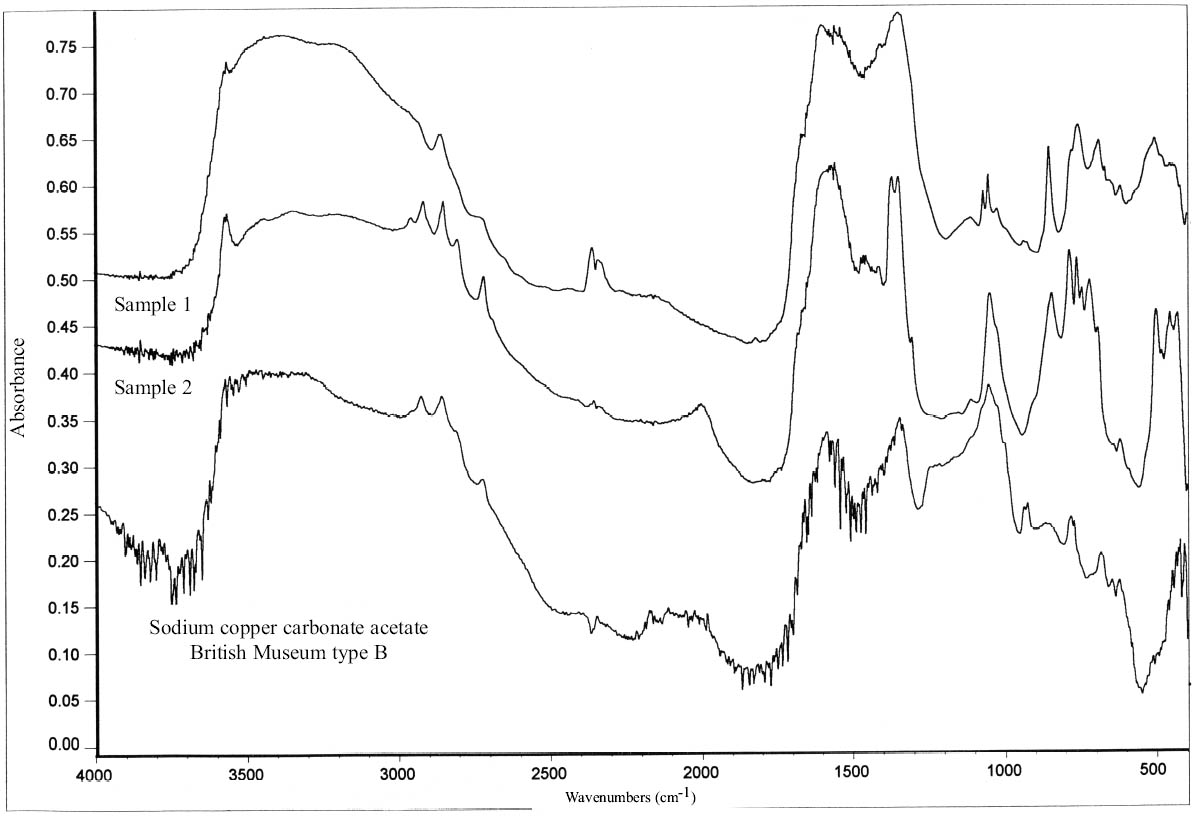
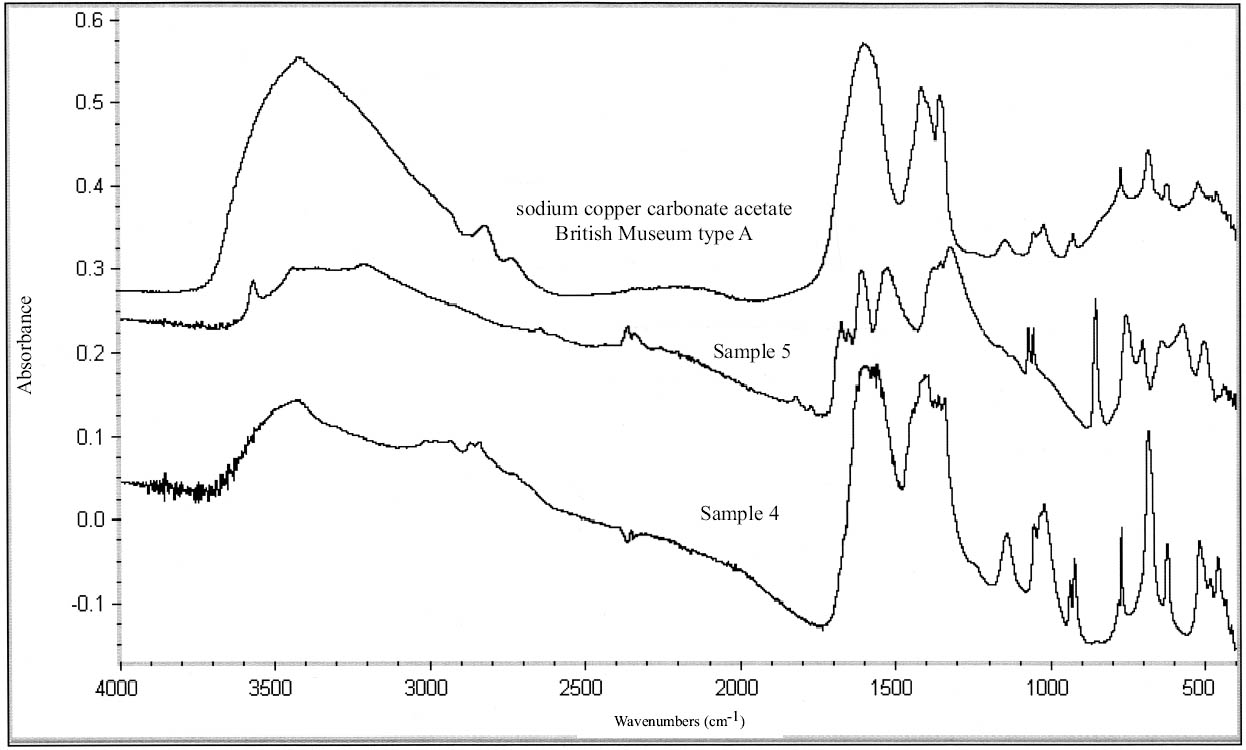
2.3 RESULTS OF CORROSION ANALYSISThe results of the analyses are presented in table 2. The blue corrosion (samples 1, 2, 3, 4, and 5) has been identified as a sodium copper carbonate acetate [NaCu(CO3)(CH3COO)], which presents similarities with the sodium copper acetate compounds found on Egyptian copper alloy objects in the British Museum (Thickett 1998; Thickett et al. 1998; Thickett and Odlyha 2000). An x-ray diffraction pattern for sodium copper carbonate acetate is not available in the International Center for Diffraction (ICD) powder diffraction file. The study of the two sodium copper carbonate acetate compounds found in the British Museum resulted in the publication of type A (Thickett and Odlyha 2000), whereas type B required further characterization. The XRD and FTIR data of types A and B are different and consistent (Thickett 2002). The sodium copper carbonate acetate found in the Agora has been compared to British Museum types A and B. The XRD data for both types of British Museum blue corrosion have been included for comparison with Agora corrosion sample 1 (table 3). FTIR data for the British Museum blue corrosion are compared with Agora corrosion samples 1 and 2 in table 4 and samples 4 and 5 in table 5. The FTIR scan that corresponds to table 4 is shown in figure 4, and the FTIR scan corresponding to table 5 is shown in figure 5. The occurrence of these compounds may become more widely recognized now that the analytical data for their identification have been published. Sample 1 presents similarities with the XRD patterns for both British Museum blue corrosion products, types A and B. Peaks that match type A
The white corrosion in sample 2 was identified by FTIR as sodium acetate trihydrate (CH3COONa.3H2O) and was confirmed with XRD (table 6). Both FTIR and XRD are not sensitive to components that constitute less than 5–10% of a sample, so such quantities of sodium acetate trihydrate with the sodium copper carbonate acetate would not be detected. Sodium acetate trihydrate has been identified on objects from the Burrell Collection, Glasgow, Scotland, as either needlelike or powdery (Tennent and Baird 1992). The Agora compound presented the same morphologies. In the Burrell Collection this white corrosion was found in association with blue corrosion, as was the case at the Agora and the British Museum (Tennent et al. 1993). The reported solubility of sodium acetate trihydrate in water was confirmed in the Agora (Weast and
|