SILVER-MIRRORING EDGE PATTERNS: DIFFUSION-REACTION MODELS FOR THE FORMATION OF SILVER MIRRORING ON SILVER GELATIN GLASS PLATESGIOVANNA DI PIETRO, & FRANK LIGTERINK
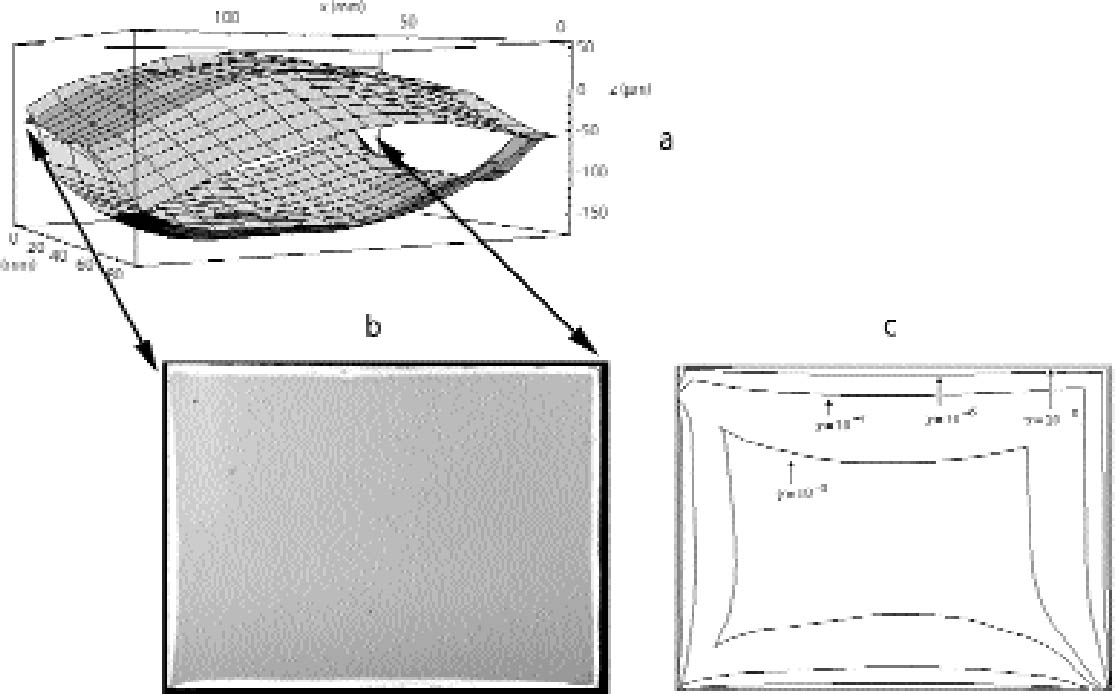
5 RESULTS5.1 PLATE DISTANCES AND EDGE PATTERNS IN AN UNALTERED STACKThe shapes of four individual plates originating from two pairs of nonprocessed plates from the Cueni Collection were measured with the microscopic focusing technique described in section 4.1. All these plates were found to be concave toward the emulsion. Typically only three out of four corners are in plane. As a result, two plates from a pair touch on only three corners. As a typical example, the distance variation between the pair of plates depicted in figure 9 is shown in figure 11a. The maximum distance between the two plates at the center of the plates is roughly 100 μm. Although in this study no attempt has been made to quantify the density profiles of the silver-mirroring edge patterns, the observed visual density can serve as a rough indication of the mass density distribution of mirroring particles. It should be borne in mind, however, that the visual intensity of silver mirroring is determined not only by the amount of mirroring but also by the size and distribution of particles making up the mirroring layer. The measured plate distances are in qualitative agreement with the corresponding silver-mirroring edge pattern shown in figure 11b. The silver mirroring extension decreases at the corners, where the plates are in contact, and increases when moving toward the center of the sides, where the plates are far apart. The silver-mirroring extension at the upper right corner does not follow this trend, consistent with the tilted position of the upper plate. The question was raised as to whether the buckling of the plates was related to the shrinking of the gelatin emulsion during aging. A preliminary examination of 137 plates showed that a majority, 106 plates (78%), were concave toward the emulsion side. The remaining 31 plates (22%) were convex toward
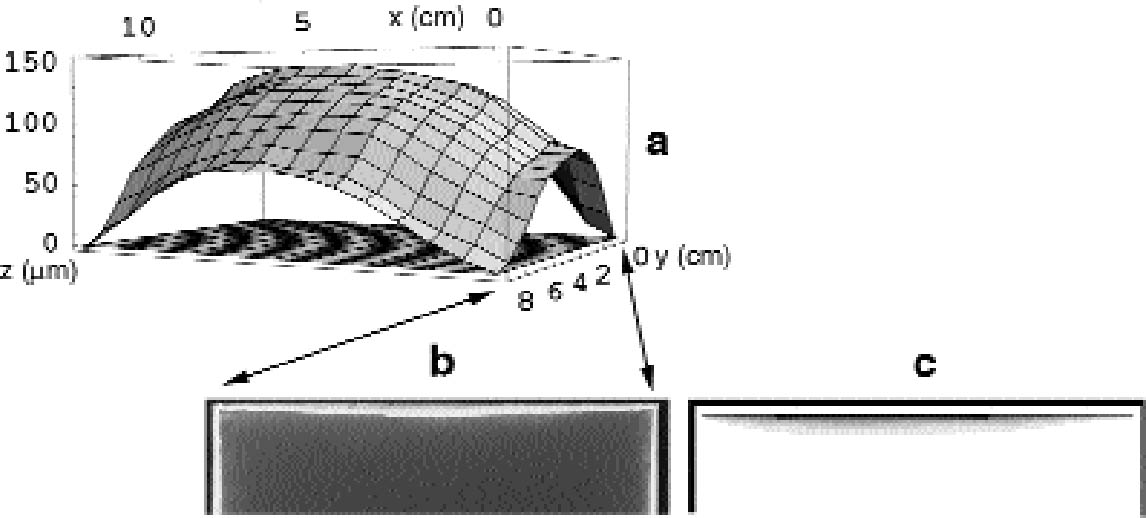
In figure 11c, the silver-mirroring extension is calculated from equation (3.2) for different reaction probabilities, using as distance between the plates that measured from figure 11a and as gas parameters the values for hydrogen peroxide (M = 34 g mol-1 and D=0.188 cm2 s-1). It can be seen that the reaction probability γ giving the silver-mirroring extension best matching with the pattern found on the plate is of the order of 10-6. 5.2 INCUBATION CHAMBER RESULTSThe microscopic focusing technique explained in section 4.1 was also employed to measure the shapes of the plates used in the stack exposure experiment depicted in figure 10a. The historical plate that was used had a concave shape, with concavity of approximately 150 μm in the direction of the emulsion. The new Agfa Avipan 100, however, was flat to a precision of 5 μm. The measured distance variation between the two plates is indicated in figure 12a. Figure 12b is a photograph of the edge pattern visible on the emulsion side of the Agfa Avipan 100 plate after exposure of the stack for a few days. The shape of the pattern is qualitatively consistent with the measured distance variation of the two plates. The extension of the silver mirroring decreases at the corners, where the two plates are in contact,
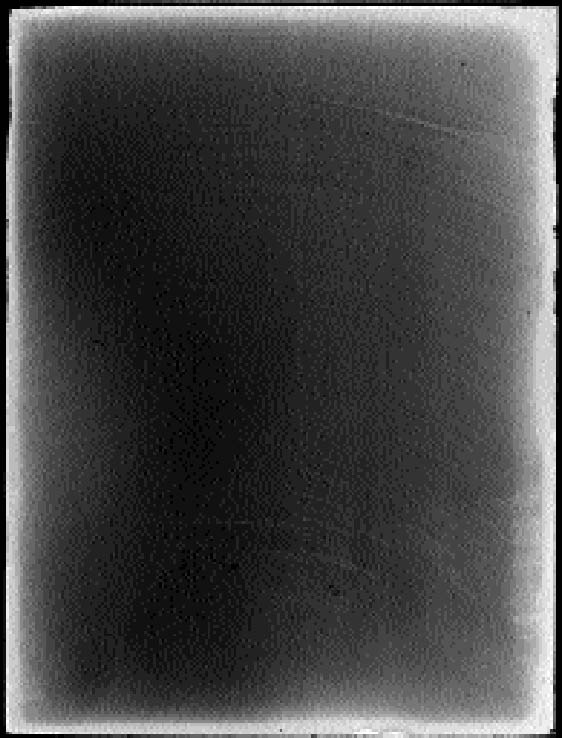
Figure 12c shows the pattern of silver mirroring calculated with equation (3.1) and using as gas parameters the values for hydrogen peroxide (M = 34 g mol-1 and D = 0.188 cm2 s-1) and as reaction probability γ = 5�10-6. Figures 13 and 14 show the patterns of silver mirroring obtained from the single plate exposure experiments. On the plate that was exposed without ventilation, the silver-mirroring intensity is clearly enhanced at the edges of the plate. On the plate that was exposed with ventilation, the silver-mirroring intensity is homogeneously distributed over the plate.
|