SILVER-MIRRORING EDGE PATTERNS: DIFFUSION-REACTION MODELS FOR THE FORMATION OF SILVER MIRRORING ON SILVER GELATIN GLASS PLATESGIOVANNA DI PIETRO, & FRANK LIGTERINK
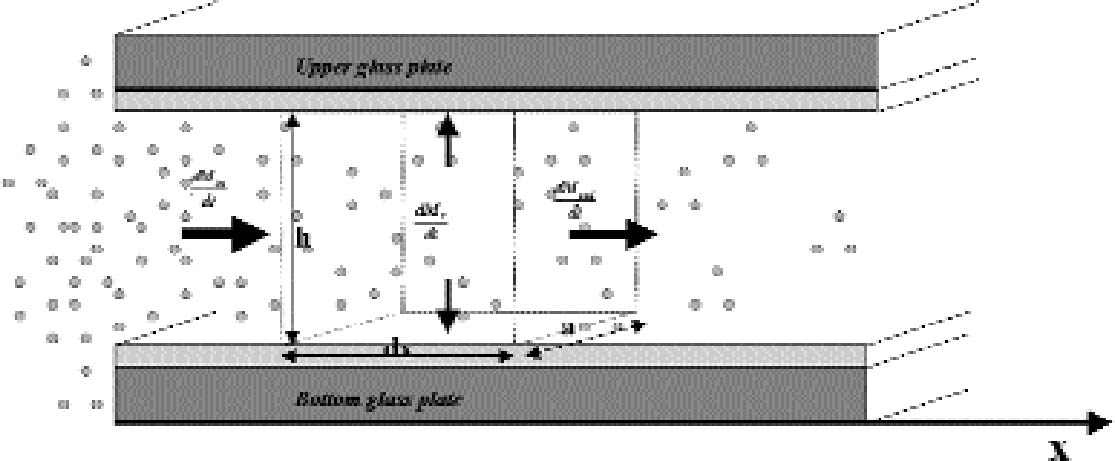
APPENDIXAPPENDIX 1In this appendix an equation is derived to describe the diffusion of a gas between two reactive surfaces. The law of mass conservation states that, for a steady state concentration profile, the difference between the amount of gas leaving and entering a small air volume of dimensions dx � h � a (cm3) (fig. 15) per unit time [(dmout/dt) – (dmin/dt)] (g s-1) is equal to the amount of gas removed from the air volume because of reaction with the emulsion-dmr/dt (g s-1):
The left-hand part of equation (A1.1) is found by considering that the mass of gas entering through an area h � a (cm2) is the gas flow times the area and by applying the first law of diffusion, Fick's law (Crank 1975):
The right part of equation (A1.1) is found with the reaction collision theory (Volpe and Peterson 1989; Atkins 1990), that is, by calculating the number of collisions between the gas and the top and bottom emulsion surfaces per unit time and assuming that only a fraction γ of them will give rise to a reaction:
R is the gas constant (R = 8.313�107 g cm2 s-2K-1 mol-1), T (K) the absolute temperature, and M (g mol-1) the gas molecular weight. By substituting equations (A1.3) and (A1.2) in (A1.1) and simplifying, we obtain the final equation describing the gas concentration between the plates at equilibrium:
The problem (A1.4) has a simple exponential solution:
The amount of mirroring on the plate will be proportional to the amount of gas reacting with the plate per unit surface and time, the so-called gas absorption rate Ψ (g cm-2 s-1). The gas absorption rate is found by substituting the concentration profile equation (A1.5) in equation (A1.3) and dividing by the total surface area of bottom and top emulsion surfaces (2a � dx):
APPENDIX 2With the hypothesis of high reactivity and no ventilation, the steady-state diffusion equation (Crank 1975) for the gas concentration c (g cm-3) surrounding a freely exposed plate is:
The amount of gas reacting per unit surface and unit time with the plate, the so-called gas absorption rate Ψ (g cm-2 s-1), can be calculated from the concentration profile solution of (A2.1)–(A2.2) with Fick's law (Crank 1975) being equal to the gas flow J (g cm-2 s-1) calculated at the plate surface:
Problems (A2.1)–(A2.2) can be solved analytically in the case of a plate with circular shape (Landau and Lifshitz 1960, 27). The problem solved in the reference is finding the electrostatic potential Φ generated by a charged disk of radius a. This problem is identical to the gas The gas absorption rate is in this case given by:
Figure 8a shows the contour plot of the absorption rate (A2.4). In the more realistic case of a rectangular plate, problem (A2.1)–(A2.2) cannot be solved analytically. We solved the problem with the finite element analysis numerical technique. The finite element method consists of dividing the space into small areas and looking for approximate solutions in each of them. The solutions are then combined to get an approximate solution on the whole space. As this method requires a large number of calculations, it is normally performed with the aid of computer programs. We used a freeware program available on the Web called Tochnog (www.tochnog.com). The solution for a 9 � 12 cm plate was found within a three-dimensional square box with dimensions of 50 � 50 � 50 cm. The box was divided into regular cells by drawing a grid of 1.5 cm spacing. The plate resulted as being covered by 77 nodes. The program calculates the value of the gas concentration and of the gas flow at each node. The values of the gas flow at the nodes on the plate give the gas absorption rate. Figure 8b shows the contour plot of the absorption rate for the rectangular plate. APPENDIX 3In order to evaluate the buckling of a glass plate under the action of a shrinking layer of gelatin, we will analyze a simplified model. Let us consider a glass bar of length L (cm) equal to the longest side of the glass plate and of rectangular cross section of dimensions dg � δ (cm2), where dg (cm) is the thickness of the glass plate and δ is an arbitrary length with δ<<L. A gelatin layer of cross section of dimensions de � δ (cm2), where de (cm) is the thickness of the emulsion, covers the bar. The gelatin layer is taken as being attached to the glass only at the two extreme ends of the bar. During shrinking, the gelatin exerts a force directed toward the center of the bar and applied at its two ends. This force is given by the stress ς (g cm-1 s-2) applied by the gelatin times the gelatin cross section:
The theory of the buckling of beams (Feynman et al. 1964) allows for the prediction of the minimum force applied at the two ends of the bar necessary to deform it, the so-called Euler force:
Substituting (A3.3) in (A3.2) and equating (A3.1) and (A3.2), we get an expression for the minimum stress able to deform the bar:
Taking L as the largest side of the glass plate, L = 12 cm, dg = 0.13 cm, de = 5 � 10-3 cm, and Y = 3 � 1011 to 6 � 1011 g cm-1 s-2, depending on the glass composition (Uhlmann 1980), we get ς = 7.5 � 108to 1.5 � 109 g cm-1 s-2. This value can be compared The minimum stress necessary to buckle the glass bar is 20 to 50 times greater than the stress actually exerted by a layer of drying gelatin. No data are available in the literature for the stress developed by a gelatin layer during aging. ACKNOWLEDGEMENTSThe authors would like to thank U. B. Kejser for providing many references on silver mirroring, S. Dobrusskin for providing the plates shown in figures 1 and 3, and J. S. Johnsen for providing the recipe modified from the standard hydrogen peroxide test. REFERENCESAtkins, P. W.1990. Physical chemistry. 4th ed.Oxford: Oxford University Press. British Journal of Photography. 1901. The permanency of toned bromide prints. British Journal of Photography18 (January):39–40. Crank, J.1975. The mathematics of diffusion. Oxford: Oxford University Press. Feynman, R. P., R. B.Leighton, and M.Sands. 1964. The Feynman lectures on physics. Vol. 2. Reading, Mass.: Addison-Wesley. Chap. 38. Hendriks, K. B.1989. The stability and preservation of recorded images. In Imaging Processes and Materials, ed. J.Sturge et al. New York: Van Nostrand Reinhold. 637–84. Henn, R. W., and D. G.Wiest. 1963. Microscopic spots in processed microfilms: Their nature and prevention. Photographic Science and Engineering7(5):253–61. ISO. 2000. Imaging materials: Methods for the evaluation of the effectiveness of chemical conversion of silver images against oxidation, ISO 18915. Geneva: International Organization for Standardization. Koob, S.2000. Personal communication. Corning Museum of Glass, One Museum Way, Corning, N.Y. 14830. Landau, L. D., and E. M.Lifshitz. 1960. Electrodynamics of continuous media. Oxford: Pergamon Press. Mecklenburg, M. F., M.McCormick-Goodhart, and C. S.Tumosa. 1994. Investigation into the deterioration of paintings and photographs using computerized modeling of stress development. Journal of the American Institute for Conservation33(2):153–70. Nielsen, U. B., and B.Lavedrine. 1993. Etude du miroir d'argent sur les photographies. In Les documents graphiques et photographiques. Paris: Archives nationales. 131–43. Nishimura, D.. 2000. Personal communication. Image Permanence Institute, Rochester Institute of Technology, Rochester, N.Y. Torigoe, M. K. Ohmura, S.Yagami, and H.Iwano. 1984. A challenge in preservation of black and white photographic images. Scientific Publications of the Fuji Photo Film Co., Ltd.29: 31–36. Uhlmann, D. R., ed.1980. Glass: Science and technology. New York: Academic Press. Volpe, L., and P. J.Peterson. 1989. The atmospheric sulfidation of silver in a tabular corrosion reactor. Corrosion Science29(10):1179–96. SOURCES OF MATERIALSGlass plate negatives: Agfa APX Avipan 100 (90�120�1.5 mm)Agfa-Gevaert AG Stettbachstrasse 7 CH-8600 D�bendorf Switzerland Fluka Chemie AG Postfach 260 CH-9471 Buchs SGI Switzerland AUTHOR INFORMATIONGIOVANNA DI PIETRO studied physics at the University of Milan, where in 1994 she received her master's degree with a specialization in experimental physics. Since 1996 she has collaborated with the Instituut Collectie Nederland as a conservation scientist. In June 2002 she received her Ph.D. in chemistry at the University of Basel's Laboratory of Scientific Photography with a thesis on silver mirroring on silver gelatin glass plates. Address: Laboratory of Scientific Photography, University of Basel, Klingelbergstrasse 80, CH-4056, Switzerland. FRANK LIGTERINK, a paper conservator, graduated in 1989 from the Opleiding Restauratoren, Amsterdam. From 1989 to 1995 he studied at the Vrije Universiteit, Amsterdam, where in 1995 he received his master's degree in physics with a specialization in theoretical physics. In 1996 he received his qualification as a physics teacher. Currently he is working at the Instituut Collectie Nederland as a conservation scientist. Address: Instituut Collectie Nederland, Gabriel Metsustraat 8, 1071 EA Amsterdam, The Netherlands. |