VERTICAL GRADIENTS OF POLLUTANT CONCENTRATIONS AND DEPOSITION FLUXES ON A TALL LIMESTONE BUILDINGVICKEN ETYMEZIAN, CLIFF I. DAVIDSON, SUSAN FINGER, MARY F. STRIEGEL, NOEMI BARABAS, & JUDITH C. CHOW
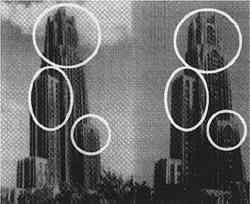
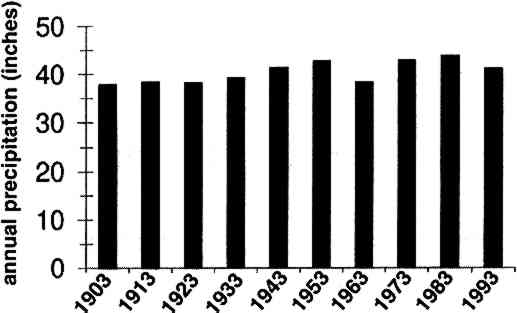
5 DISCUSSION5.1 AIRBORNE CONCENTRATIONS OF CHEMICAL SPECIESThe airborne concentration data have been analyzed statistically using a two-sided t-test for averages. Significant differences in concentrations among the three sampling locations do not exist for any of the pollutants considered (table 4). TABLE 4. P-VALUES FOR TWO-SIDED T-TESTS OF SAMPLE MEAN FOR CHEMICAL SPECIES AIRBORNE CONCENTRATIONS The presence of a vertical concentration gradient requires that two conditions hold true. First, emissions from nearby sources must be sufficiently large to increase pollutant concentrations above the urban background level. Second, atmospheric mixing must be sufficiently small that vertical concentration differences can persist. SO42− and NO3− particles and HNO3 gas are generally secondary pollutants that form from chemical reactions in the atmosphere (Seinfeld and Pandis 1998). Therefore, on spatial scales corresponding to the height of the cathedral, airborne concentrations of these species are expected to be spatially homogeneous since their formation is sufficiently slow to allow mixing. SO42− and NO3− are sometimes associated with coarse particles, in part due to sorption of SO2 and HNO3 onto alkaline soil dust (Wolff 1984). The absence of a concentration gradient in SO42− particles and total NO3− suggests that if these species are associated with coarse particles, there is adequate mixing to distribute them over the height of the cathedral. The fact that elemental carbon does not exhibit a concentration gradient suggests that motor vehicle emissions from adjacent streets and the emissions from the nearby coal-fired steam plant are either rapidly mixed or else do not contribute significantly to concentrations at or above the 5th floor. To investigate the extent of pollutant mixing near the building, a limited number of measurements of vertical wind speed were conducted on the 5th and 16th floor patios on five days during the term of this project. Results show the presence of strong vertical air motions along the walls of the building on all days tested. Although preliminary, these results provide qualitative evidence of vertical mixing as a consequence of wind impinging on the cathedral. 5.2 LASER PARTICLE COUNTSIn the >0.5 μm size range, particle counts by LPC do not show a significant difference between the 5th and 16th floors (figs. 7, 8). However, >5 μm particle counts are on average 30% higher on the 16th floor than on the 5th floor. Because of their greater inertia, sampling of large particles is more sensitive to factors such as inlet angle, flow characteristics in the inlet, and ambient wind direction. Therefore, the discrepancy in >5 μm concentrations between the two floors should be regarded with caution. Note that the chemical species data do not show a difference between the 5th and 16th floors; if the >5 μm particle concentrations are indeed slightly greater on the 16th floor, then it is unlikely that there is much SO42−, NO3−, or carbon mass associated with these large particles. Figures 7 and 8 both demonstrate that particle counts can vary considerably over the course of a day. In figure 7, maxima and minima for >0.5 μm particle concentrations coincide well with those for >5 μm particles. This agreement between concentrations in the two particle sizes is found in most of the LPC data. However, changes in >0.5 μm particle concentrations are not well proportioned with those of >5 μm particles. The correlation coefficient for the data in figure 7 is 0.41, whereas the 24-hour-based correlation coefficients for all available LPC data range from −0.27 to 0.90, with a median value of 0.37. The low positive and occasional negative correlations are not surprising. Some meteorological parameters such as atmospheric stability may qualitatively affect >0.5 μm and >5 μm particle concentrations similarly. However, particles in these two size ranges are generally not emitted by the same sources and are not subjected to identical transport processes. Table 3 shows that concentrations on Saturdays and Sundays are lower than those on weekdays. This finding is consistent with the expectation of reduced motor vehicle traffic and, possibly, reduced operations of some stationary sources on weekends in the Pittsburgh area. 5.3 VERTICAL DEPOSITION FLUX AND VERTICAL DEPOSITION VELOCITIESThere is considerable spatial variability in SO2 deposition within each patio. However, most deposition velocities (Vd) are in the range 0.6–1.0 cm/s, a finding in agreement with unpublished data obtained previously at the cathedral (Lutz et al. 1994; Etyemezian et al. 1995). The values are also in agreement with measurements using the same method by Wu et al. (1992) on a bronze equestrian statue in Gettysburg National Military Park. The greatest deposition velocities on the 16th floor correspond to locations 16a and 16c. The average deposition velocities for the full year are 0.85 � 0.13 cm/s for the 16th floor, compared with 0.69 � 0.07 cm/s for the 5th floor. The sampling locations on the 16th floor are more exposed than those on the 5th floor, a difference that may, in part, be responsible for the slightly higher deposition velocities. Note that sites 5a and 5f, the most exposed sites on the 5th floor, have the highest deposition velocities on that floor. It is also of interest that the relative magnitudes of deposition velocity at one location with respect to another location do not change seasonally. For example, Vd is consistently higher at location 16c than it is at locations 5b, 5c, 5d, 5e, and 5f. Unpublished results of previous sampling at the cathedral show a similar trend for SO42− particle deposition (Gould et al. 1993; Lutz et al. 1994; Etyemezian et al. 1995). These data also show that deposition fluxes of SO42− particles to surrogate surfaces are usually at least a factor of 10 lower than those for SO2. In the earlier studies, surrogate surfaces for SO42− particle and SO2 gas collection were exposed on the 5th floor at five locations. Locations 5f, 16a, and 16c are on parts of the building where there is no visible soiling. Location 5a is inside a 0.5 m heavily soiled indent on the wall. The portion of the wall immediately outside the indent and closer to the outer corner of the patio is clean. Overall, those sampling locations with the highest deposition velocities correspond to unsoiled parts of the building surface, and these are in relatively exposed areas. Furthermore, observations of the building during rainstorms and results from a recent modeling study (Etyemezian et al. 1998a) both suggest that these exposed areas also experience the most impingement by rain. Thus, we propose that deposition of pollutants and surface rain washing are processes in dynamic competition. Archival photographs showing changes in soiling from the 1930s to the present support this hypothesis. These photographs show heavy soiling in the early years, with decreasing amounts of soiling in more recent times. Examples of two photographs, from the late 1930s and from 1995, are shown in figure 11. The first photograph shows extensive soiling on the southwestern facade. In contrast, the later photograph shows that the top one-third of the building is virtually free of soiling, and that the demarcation line between soiled and unsoiled surfaces has receded on other parts of the building. Figure 12 indicates that the amount of annual precipitation has been roughly constant over these decades. However, airborne concentrations of SO2 and particles have decreased steadily over the same time period (Davidson 1979). Thus, those areas of the facade that were soiled in the late 1930s have become unsoiled in recent years because the rate of removal of soiled material by rain washing is greater than the rate of soiling by pollutant deposition and chemical reaction. The earlier photograph suggests that the opposite was true in the late 1930s.
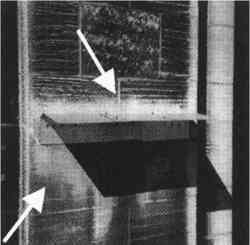
A study of the composition of the limestone on the Cathedral of Learning (McGee 1997) supports the hypothesis that the soiling is a direct result of pollutant deposition. McGee has collected 37 samples of black, light, and red-brown surface material for examination by optical microscopy and scanning electron microscopy with energy dispersive x-ray analysis of some samples. The black samples are composed primarily of gypsum (CaSO4) and contain numerous iron-, silicon-, and aluminum-rich fly ash particles. This finding is attributed to deposition of metal-containing particles and sulfur from pollutant sources in the area. The light surfaces are primarily calcite with only minor amounts of gypsum and metals. McGee (1997) reports that the microscopic and macroscopic appearance of light samples is similar to that of other limestone samples that are regularly washed either by rain or by routine cleaning. The color of the red-brown samples is attributed to rust from small metal spheres lodged in the stone, probably as a result of surface finishing of the limestone block. It is of interest that one of the rain shields shown in figure 4 was deployed in a soiled area on the 5th-floor patio in January 1993; since then, the surface of the stone immediately above the rain shield has become cleaned by splashing raindrops (fig. 13). Clearly, the presence of this rain shield has caused a local disturbance in the balance between pollutant deposition and surface rain washing and has enhanced the amount of washing.
5.4 APPLICABILITY OF RESULTS TO OTHER LIMESTONE BUILDINGSThe absence of a vertical pollutant concentration gradient is probably due to a combination of factors that have implications for buildings in other areas. First, it is likely that vertical mixing is enhanced by the presence of the building; tall buildings in other areas may also have strong upward air motions that can deliver pollutants generated near the ground to upper levels. Second, the location of pollution sources around the cathedral can greatly affect the airborne concentrations at the building. The cathedral is located in a major urban area with considerable local traffic as well as mobile and stationary sources for several kilometers in all directions. Thus, the contributions from nearby sources (within a few hundred meters) may be diminished by the presence of numerous regional pollution sources. Note that pollutants from several kilometers away have time to mix vertically in the atmosphere and can increase airborne concentrations at higher elevations. Effects of nearby sources may be more pronounced in cases where a building is located in a less-polluted setting. Third, the presence of nearby buildings is likely to have a major effect on dispersion near any building. The cathedral is considerably taller than the surrounding buildings and is 80 m from the nearest buildings to the north and west and over 120 m from the nearest buildings to the south and east. This isolation eliminates some of the trapping of pollutants that may occur in narrow street canyons, as reported by Lee and Park (1994). It must be noted that no measurements in the present study were conducted below the 5th floor, and thus conclusions regarding the absence of a concentration gradient apply only above this level. The concept of pollutant deposition and rain washing as competing processes has implications for other buildings. Comparing modern and archival photographs of the cathedral shows general decreases in the soiling that are qualitatively consistent with decreases in pollutant concentration. Archival photographs of buildings where soiling is due to microbial activity may show distinctly different patterns. |