VERTICAL GRADIENTS OF POLLUTANT CONCENTRATIONS AND DEPOSITION FLUXES ON A TALL LIMESTONE BUILDINGVICKEN ETYMEZIAN, CLIFF I. DAVIDSON, SUSAN FINGER, MARY F. STRIEGEL, NOEMI BARABAS, & JUDITH C. CHOW
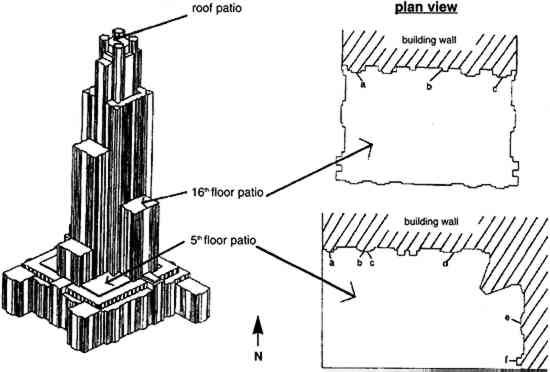
3 EXPERIMENTALVertical gradients of pollutant concentrations and deposition fluxes were measured by sampling at varying elevations on the Cathedral of Learning. Three locations were chosen for sampling: the 5th floor and 16th floor patios on the southeastern facade and the patio on the roof (fig. 2). The southeastern facade was chosen for two reasons. First, it was one of the two heavily soiled sides of the building (the northeastern facade being the other). Second, the 5th floor and 16th floor patios on the southeastern facade were frequently on the windward side of the cathedral (fig. 3) where mixing is not affected by the wake cavity of the building.
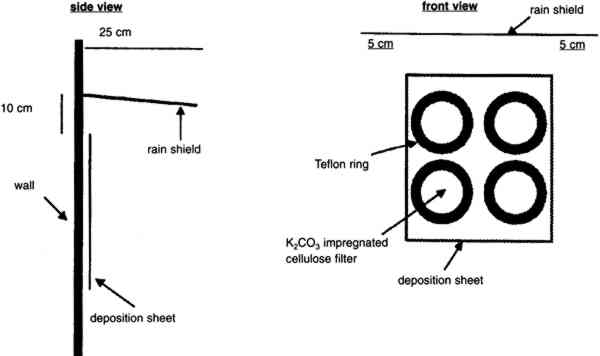
The vertical gradient experiments were conducted on four separate occasions between November 20, 1995, and August 21, 1996. The experiments were scheduled so that representative sets of data were obtained during the different seasons of the year (table 1). Each set of experiments included four consecutive sampling periods of 1 week each. Sampling was uninterrupted throughout this period except for approximately 3 hours each week for changing samples. Airborne concentrations of SO42− particles, SO2 gas, and total NO3− species (NO3− particles and HNO3 gas) were measured. Airborne concentrations of elemental and organic carbon particles were measured during the fall and winter experiments only. For the spring and summer experiments, polycarbonate membrane filters were used in place of the carbon measurements to obtain samples for scanning electron microscopy (SEM) analysis. Laser particle counters were used to provide real-time data for number concentrations of particles with diameter > 0.5 μm and > 5 μm. Each set of experiments also included two 2-week measurements of SO2 deposition fluxes. TABLE 1. SAMPLING SCHEDULE AT THE CATHEDRAL OF LEARNING All sampling was conducted using identical sets of sampling equipment at each site, two replicate sets for airborne concentrations and four sets for deposition fluxes. Airborne concentrations were measured on patios on the 5th floor, 16th floor, and roof of the cathedral. Deposition flux and laser particle counter measurements were conducted on the 5th and 16th floors only. 3.1 AIRBORNE CONCENTRATIONS OF CHEMICAL SPECIESMany of the procedures for measuring concentrations at the cathedral were developed by Gould et al. (1993). Air samplers were placed on supports 1.5 m above the surface of the patios. Concentrations of anions were measured using multistage Teflon filterpacks (Savillex Corp.) with 47 mm diameter filters. Each filterpack included a Teflon Zefluor filter (Gelman P5PL047, 1 μm pore size) followed by two back-to-back nylon Nylasorb filters (Gelman 66509). These were followed by two sets of potassium carbonate impregnated cellulose filters (Whatman 1441-047, ashless), with each set consisting of two back-to-back filters. The Teflon filters were used to sample SO42− and NO3− particles, while the nylon and cellulose filters were used to sample HNO3 and SO2, respectively. A critical flow orifice maintained the flow at 1 liter per minute. Stainless steel filter holders (Millipore XX50-047-10, open-faced) were used with 47 mm diameter quartz fiber filters (Pallflex 2500 QAT-UP) to measure carbon. A critical flow orifice maintained the flow at 3 liters per minute. These same filter holders were used with polycarbonate membrane filters (Costar Nuclepore PC-MB-47 mm, 0.4 μm pore size) for SEM analysis. A metering valve (Hoke 1656 G4YA) was used to maintain the flow at 0.2 liters per minute through the membrane filters. For all filter sampling systems, a dry test meter (Singer DTM-115) was used to obtain accurate flow rates at the beginning and end of each sampling run. The Teflon, nylon, quartz, and polycarbonate filters were used as received from the manufacturer without washing. The cellulose filters were immersed in a solution consisting of 76 ml deionized (DI) water, 24 ml glycerin, and 15 g K2CO3. The filters were then dried on a hot plate covered with clean aluminum foil. Dry filters were placed in clean polyethylene bags (Clean Room Products 6 MIL-0406), heat-sealed, and stored in a dessicator. One batch of cellulose filters was prepared at the beginning of each of the four sets of sampling experiments and used throughout that set. Filterpacks and associated tubing were washed using three rinses with DI water, one rinse with methanol (Fisher Scientific, Optima grade), 30-minute sonication in a DI water bath, and two subsequent rinses with DI water. All procedures after washing such as drying, loading, assembling, and unloading of the filterpacks were performed inside a laminar flow hood. Filters were handled only with clean Teflon-coated tweezers. Assembled filterpacks were placed in clean polyethylene bags. Field blanks of all filters were prepared in the same manner as the samples. Air was drawn through the blanks for 3-8 minutes prior to each sampling period. When unloading the filterpacks, the same contamination control procedures were observed. The Teflon, nylon, and cellulose filters were placed in clean 30 ml polypropylene bottles. The two sets of back-to-back cellulose filters were placed in separate bottles, and each set was analyzed individually. The quartz fiber and polycarbonate membrane filters were unloaded into clean 47 mm polypropylene petri dishes. With the exception of the polycarbonate membrane samples, all filters were frozen for later analysis. The quartz fiber filters were shipped frozen to the Desert Research Institute for analysis by the thermal optical reflectance method (Chow et al. 1993). The Teflon, nylon, and cellulose filters were analyzed by ion chromatography. Extractions were performed in a laminar flow hood. The upstream faces of the Teflon filters were wetted with 1 ml methanol, and 29 ml of DI water were subsequently added to the sample bottle. Thirty ml of 0.003 M sodium hydroxide and 30 ml of 0.05% hydrogen peroxide were added to the bottles containing the nylon and cellulose filters, respectively. Sample bottles were sonicated for 45 minutes. After sonication, the nylon and Teflon filters were removed from the sample bottles and discarded. The cellulose filters remained immersed in the extract solution. Extract solutions were refrigerated in order to maintain sample integrity. Ion chromatography analysis was generally performed within 2 or 3 days of the extractions. Analyses were performed on a Dionex 4500i ion chromatograph using a 4 mm AS4A anion column. Samples and standard solutions for calibrating the instrument were manually injected. After each injection, the syringe was rinsed with DI water several times. A standard solution was analyzed at least once every 2 hours. All sample handling occurred in a laminar flow hood. 3.2 LASER PARTICLE COUNTERSTwo TSI model 3755 laser particle counters (LPC) were used in these experiments. The LPCs were mounted with the nozzle side facing down at a height of 1.5 m above the patios. A laptop computer was used to log particle count data on a 2-minute basis. Some data were not properly logged during sampling periods either because the laptop did not record LPC signals or because the inlet was clogged with large particles. Problematic data were easily recognized and discarded. High particle concentrations measured by the LPC had to be corrected for double counts in accordance with the manufacturer's recommendations. 3.3 VERTICAL DEPOSITION SAMPLINGDeposition fluxes of SO2 were measured on 125 mm potassium carbonate impregnated cellulose filters (Whatman 1441-125, ashless). Four of these filters were mounted on a thin Teflon-coated aluminum plate. Flat Teflon rings (inner diameter = 105 mm) were placed on top of the filters. Labeling tape was used to fasten the rings to the plate. The fully assembled plates were transported to the cathedral in a polyethylene tray encased in a clean bag. Field blanks were exposed for approximately 10 minutes in the same manner as the samples. As with the airborne concentration filters, loading, unloading, and drying of equipment were performed on a clean surface in a laminar flow hood. Extraction and ion chromatography analyses were conducted in the same manner as for the airborne concentration cellulose filters, except that 120 ml of hydrogen peroxide extraction solution was used for each filter. Nine Teflon-coated aluminum plates were exposed simultaneously in each deposition sampling period. The samples were placed at six locations on the 5th floor (5a–5f) and three locations on the 16th floor (16a-16c) (see fig. 2). Locations 5a–5d and 16b were in areas where visible soiling was present, while the remaining four were in areas that were free of soiling. To avoid exposure to rain, each Teflon-coated aluminum plate was placed under a galvanized aluminum rain shield (fig. 4). Locations 5b and 5c were adjacent and were placed under one larger rain shield. Previous work has shown that rain shields used in different configurations may affect SO42− particle dry deposition (Davidson et al. 1985). The effect of the rain shields on SO2 gas deposition was considered by comparing fluxes to the top two and bottom two deposition surfaces for all sampling locations. If the rain shield had interfered with SO2 delivery, then deposition to the upper surfaces should have been different from deposition to the lower surfaces. The average fluxes to the top and bottom surfaces were not found to differ with statistical significance.
|