FURTHER STUDIES ON TRANSPARENT GLAZE FADING: CHEMICAL AND APPEARANCE KINETICSPAUL M. WHITMORE, & CATHERINE BAILE
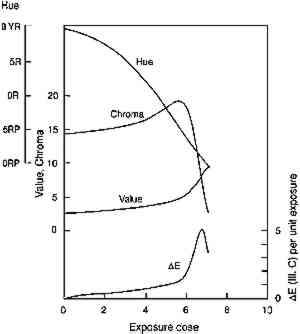
4 APPEARANCE KINETICS OF GLAZE FADING4.1 MODEL BEHAVIORAs a first approximation one can consider that loss of colorant in a glaze will produce exactly the same color changes that occur when a glaze is formulated with progressively smaller colorant loadings. For an initially dark glaze, one may expect a chroma increase accompanied by a hue shift (from increased reflectance at wavelengths off the peak absorption), followed by the chroma loss and value increase normally associated with “fading” as the reflectance of the main absorbed wavelengths begins to increase. These color changes have been described in previous reports concerned with the appearance changes in fading glazes (Johnston-Feller and Bailie 1982; Johnston-Feller 1986). However, it is important to realize that these changes will not occur steadily with time, and our understanding of the chemical kinetics of the colorant loss allows us to estimate the “appearance kinetics,” or the rates at which appearance changes will be likely to occur. The progression of color changes during photochemical destruction of the colorant will provide a clearer picture of the changes observable during the light exposure of the film. Thus, it will be possible to recognize the periods during which the most serious color The appearance kinetics are estimated by calculating the spectral changes (and subsequently the color attributes) in a glaze that is photochemically reacting as modeled in the previous section, assuming absorption of a range of wavelengths. The fading of an idealized red glaze having an absorption spectrum similar to PR66 has been calculated, and the incomplete-hiding Kubelka-Munk formulas (Judd and Wyszecki 1975, 426–28) were used to derive the changes in the reflectance spectrum (assuming a white substrate) and in the color (using the usual procedures, outlined in Appendix 2, to derive tristimulus values, color differences, and Munsell notation) due to the colorant concentration loss. The changes in Munsell notation are shown in figure 7. As seen in the colors of the fresh glazes, the colorant loss in the initially dark glaze at first results in an increase in the reflectance at the blue wavelengths (just to shorter wavelengths from the absorption maximum). As the blue reflectance increases, the hue shifts from red toward purple. In fact, this hue shift appears to be the most prominent color change in the dark glaze as it fades. At the same time the chroma, which is initially quite high for this model glaze, increases because of the greater difference between the levels of low reflectance (at the absorption maximum) and high reflectance (at the long wavelengths). When the colorant concentration is lowered so much that the reflectance at the peak absorption wavelengths begins to increase, then pronounced and rather sudden color changes occur, notably a decrease in chroma and an increase in value. It is worth noting that the color changes normally connoted by the term “fading” are evident only at this stage, when the reflectance is increasing across the entire spectrum. For darker glazes, colorant loss produces only slight changes in chroma and value.
The rapidity of the color changes once this stage
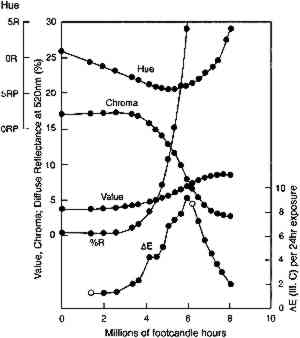
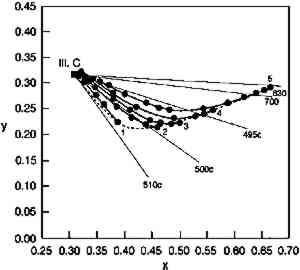
Clearly, with larger reflectance changes being produced for glazes having intermediate reflectance minima, the rate of color change will not be constant during the light exposure. As glazes acquire such intermediate reflectance minima they will display a much greater light sensitivity. This sensitivity can be measured by calculating the color difference produced by a unit of light exposure, termed here the “incremental” color difference. This quantity merely sums the changes in color attributes to get a single approximate amount of perceived color change for a unit of exposure (see Appendix 2 for references to the standard formulas used). The incremental color difference (ΔE per unit exposure dose) has been calculated for the fading ideal red glaze and is shown at the bottom of figure 7. This picture represents the relative light sensitivities of glazes formulated at different colorant concentrations. The darkest glazes lose colorant at the maximum (linear) rate, yet the color change is slight because little spectral change results. For the same amount of light exposure, a glaze having a reflectance minimum of about 20% (over white) will experience much larger color differences (5–10 times greater in this calculation), a difference in perceived lightfastness of as much as three blue wool steps (Feller 1975, 1978; Thomson 1978, 174-75; Feller and Johnston-Feller 1981). This result indicates that the glaze formulations of maximum light sensitivity will tend to be these glazes having intermediate reflectance minima (viewed over white). In addition to providing a picture of the relative light sensitivities of glazes having different colorant concentrations, this view can also be interpreted as the fading of a single dark glaze occurring in three stages. While losing concentration at the maximum (linear) reaction rate, a highly absorbing glaze will experience only slight color changes due to the reflectance changes away from the absorption peak. As the glaze fades so that the absorbed wavelengths are less highly absorbed, the colorant loss slows, but the magnitude of the color change increases. As the glaze passes through a stage when its reflectance at the absorption maximum is intermediate 4.2 COMPARISON WITH EXPERIMENTThe color changes that occur during visible light exposure of PR66 glazes were measured experimentally to determine the extent to which these predicted appearance kinetics were followed. Figure 9 shows the change in Munsell hue, value, and chroma as a moderately dark glaze faded. The predicted hue shift from red toward purple is apparent in the early stage of the exposure. The hue begins to shift back toward the red in the later stage because of the apparent formation of a product, or the preferential fading of a component, that causes the glaze to fade “off shade”: that is, the faded glaze is slightly redder than the unfaded glaze that has the same lower colorant content (behavior also reflected in the chromaticity coordinates in figure 10). The chroma shows the predicted slight increase during the exposure, followed by a rapid decline. The Munsell value is also relatively constant until experiencing a gradual increase coincident with the chroma loss. These sudden changes in chroma and value occur when the glaze becomes only partially absorbing at the
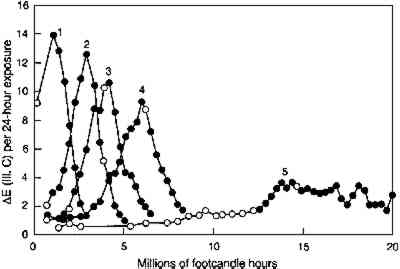
Just as the previously faded glazes showed slower rates of concentration loss than unfaded glazes of the same concentration (see fig. 6), so too do the previously faded glazes show lower relative light sensitivities (as measured by the incremental color difference) than the unfaded glazes of the same colorant concentration. Figure 11 shows the incremental color differences of several glazes of different initial colorant contents (glazes 1–5, in order of increasing content) as they fade to acquire an intermediate reflectance at the wavelength of maximum absorption. The maximum light sensitivity is seen for the initially palest glaze, and the initially darker glazes display progressively lower peak sensitivities as they become pale. In other words, as measured by their color changes, previously faded colors seem to be somewhat less sensitive than the fresh glazes of the same color. The relative sensitivities are approximately the same as the relative rate constants for the colorant loss for those glazes, as listed in table 2, with the darkest glaze being about five times less light sensitive than the initially pale glaze when both are at maximum
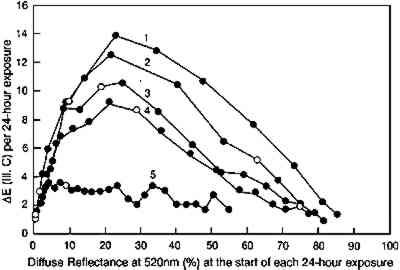
A more complete picture of the changes in lightfastness that occur as the glazes fade is shown in figure 12, in which the incremental color differences are plotted as a function of the depth of shade of the glaze. In this figure the color difference produced by each 24-hour light exposure is plotted against the depth of shade (measured by the reflectance at 520 nm, the wavelength of maximum absorption) at the start of the 24-hour exposure period. This illustration tracks the light sensitivity for the glazes as they fade and shows that sensitivity peaking for glazes having minimum reflectances of about 20%. This plot also shows the lower light sensitivities of the glazes that have been faded to varying degrees to reach the same depth of shade (i.e., the same reflectance at the wavelength of maximum absorption). The glaze that had experienced the most fading to reach this intermediate reflectance level (glaze 5) experienced color changes about five times smaller than the glaze that experienced little prior fading (glaze 1).
It is important to recognize that the behavior demonstrated here—that paler glazes have greater light sensitivities than dark glazes—was observed and noted long ago in the case of textile dyes. Barker et al. (1927) reported this behavior, writing at the time that the effect was already well known, and since then others have published experimental results for dyed textiles or cellulosic films that are similar to the results reported here for pigmented glazes (Cunliffe and Lambert 1932). While some of these observations are believed to result from effects peculiar to dyed materials (such as the aggregation of dye particles that decreases the dye's light sensitivity), the optical origins for this effect also came to be recognized. Morton (1949) was among the first to describe the mechanism of the observed “filter effect” behavior. It is worth noting, though, that Morton concluded that “pale” shades are 1–2 lightfastness grades more fugitive than “medium” shades, which are 1–2 grades more fugitive than “dark” shades, while in our study the glazes having reflectance minima (over white) of about 20% at the wavelength of peak absorption are more fugitive than either darker or paler glazes. The apparent discrepancy probably arises from the terms denoting the depth of shade: for textile dyers, “medium” dyeings, according to Morton (1949), absorb 99% of the light at the absorption peak, which would correspond more closely to the dark glazes studied in this work. The glazes having 20% reflectance minima described in this article are probably comparable to the “pale” textile dyeings, and these glazes are indeed more light sensitive than the darker shades. Textiles dyed to the equivalent of the pale glazes, which show slightly greater lightfastness than the glazes having 20% reflectance minima, were probably so pale that they were not studied in the textile research. Later work in this field, particularly that described by Stearns (1969, 32–38), supports the notion of greater sensitivity for colors having intermediate reflectance minima. In fact, Stearns calculated the incremental color changes for a textile dyed with four different dyes, and he predicted the maximum sensitivity for those systems having reflectances of about 20% at the peak absorption wavelengths, a result that is in accord with both the calculations and the experimental observations in the present study. Textile chemists have also reported the slower fading of previously faded colors. Morton (1949) attributed this characteristic to the formation of colored products of fading, which absorb the light and protect the remaining colorant by a type of “filter effect.” Giles and Forrester (1980) suggest another possibility, that the pigment is a blend of materials having slightly different lightfastness (by virtue of different particle sizes, for example). The fresh material would be more fugitive because it contains more of a fugitive component, while the material that has undergone some prior fading would be depleted in that component; |