FURTHER STUDIES ON TRANSPARENT GLAZE FADING: CHEMICAL AND APPEARANCE KINETICSPAUL M. WHITMORE, & CATHERINE BAILE
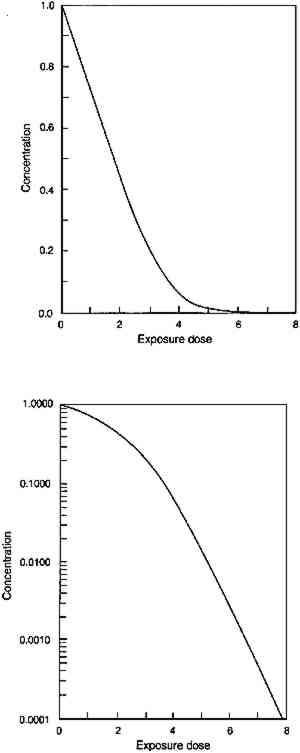
3 THE PHOTOCHEMISTRY OF GLAZE FADINGThe strong absorption of light in a restricted spectral region produces the distinctive appearance of transparent glazes. This same optical property also governs the photochemical reactions that result in the fading of the glaze. Photochemical reactions of colorants require absorption of light, and only the wavelengths of light that are strongly absorbed can cause fading of the colorant. It is often the case, too, that the rate of a photochemical reaction is proportional to the intensity of light that is incident upon the colorant (a dependence sometimes called the reciprocity principle). This dependence suggests that the rate of colorant loss in a fading glaze will be difficult to describe, for the colorant throughout a glaze is not exposed to a single incident light intensity. Rather, colorant at the surface of the glaze will be exposed to the incident light intensity, but because the surface layers absorb some of that light, colorant in subsurface strata of the glaze will be exposed to lower intensities. As a result, the colorant loss in a fading glaze will be greatest at the surface and will be progressively less at lower levels in the glaze. As pointed out by Thomson (1965), fading thus creates a stratification of the colorant in the glaze that depends on the varied light intensities within the layer. Partially absorbing glazes, which only absorb a fraction of the light intensity at the absorbed wavelengths, will fade throughout the glaze but more rapidly at the surface, where the light intensity is the highest: subsurface strata experience lower intensities because of the absorption of the upper strata. Strongly absorbing glazes, which absorb nearly all of the light in a spectral region, will fade only in a surface layer because the lower strata of the glaze see essentially none of the incident light of those wavelengths, and fading proceeds as the progression of the faded zone into the deeper layers of the glaze. This general protection of subsurface colorant by the absorption of the surface layers is a phenomenon known as the “filter effect” in dye fading (Giles and Forrester 1980). 3.1 CHEMICAL KINETICS OF GLAZE FADING: MODEL BEHAVIORTo fully describe the fading of a transparent glaze, one must consider the photochemical reaction within each individual stratum in the glaze. At each level, the light intensity will be whatever remains after absorption by the overlying layers of colorant, and the colorant in a specific stratum will be lost at a rate that depends on that local light intensity. The total colorant loss will be the sum of the losses in each individual stratum. At the next stage of fading, the new colorant distribution in the layer requires recalculation of the light intensities in each stratum, and so on to follow the course of the reaction. While laborious, such models have been devised, and the overall course of photochemistry in the stratified layers has been described This approach to modeling the loss of total colorant in a fading glaze is described in detail in Appendix 1. Some simplifying assumptions were made to provide a starting point for understanding the fading process. The most important of these assumptions are: that there is a single colorant that reacts to form colorless products; that there is a single rate constant for photochemical reaction that is not dependent on the wavelength of the absorbed light; and that the photochemical reaction rate for the total loss of colorant is dependent only on the amount of absorbed light. In this idealized glaze, one can easily predict the course of the total colorant loss and the key parameters that govern the rate of that loss. Assuming a single wavelength of incident light, the amount of visible light absorbed by the glaze (represented by its absorbance) reduces the amount of colorant in the glaze, a change that also decreases the absorbance. This faded glaze then absorbs a lesser amount of light, causing a smaller loss of concentration, and so on through the course of the fading. The concentration loss in such an idealized glaze absorbing a single wavelength of light has been calculated using equation 7 in Appendix 1; the result is shown in figure 3. An analogous calculation can be done
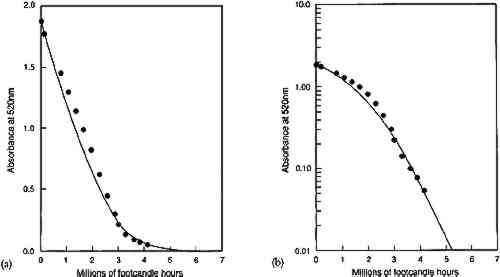
Figure 3 shows the predicted loss of colorant in an idealized glaze from absorption of a single wavelength of light. The result illustrates the key features of the concentration decrease during the course of fading. First, the model predicts that the colorant concentration should decrease at a linear rate for glazes that absorb the photochemically active wavelengths essentially completely, and the loss should approach an exponential decrease with light exposure as the glaze becomes more transparent at these wavelengths. The linear concentration loss (shown in fig. 3a) occurs in very dark glazes that absorb essentially all the light at wavelengths that will cause photochemical reaction. The slope of this linear colorant loss is dependent only on the light intensity, the film thickness, and the “quantum yield” of the reaction, or the efficiency for converting the absorbed light into faded colorant. This linear loss with time is a direct result of the dependence of the reaction rate on the amount of absorbed light. For very dark glazes, colorant loss has little effect on the absorption of light, which remains nearly complete at the absorbed wavelengths: in fact, colorant loss in these glazes will occur only in a thin region at the glaze surface. As colorant loss proceeds, the slope of the concentration change eventually begins to deviate from a linear time dependence. For the calculation of figure 3, this deviation occurs at about 2 units of exposure. At this point, the colorant loss begins to cause a decrease in the absorbance at the strongly absorbed wavelengths and thus a reduction in the reaction rate. For paler glazes, colorant loss reduces the amount of light absorption, and further fading occurs at progressively slower rates as the absorption decreases. As shown in Appendix 1, this loss eventually becomes a “first-order” chemical reaction in which the rate depends on the colorant concentration (which in turn is proportional to the light absorbance). The mathematical form describing this behavior is an exponential curve whose exponent contains the first-order rate constant for the colorant reaction. Figure 3b shows the semilogarithmic plot of the colorant loss in figure 3a, and the linear portion of the colorant loss (at exposure times above about 5 units) represents an exponential decrease, with the slope of the line equal to the exponent. In this case, the exponent approaches the value of the intrinsic photochemical reaction rate constant for the colorant that was originally assumed in the model. In other words, only when the glaze has faded to a midrange reflectance (when the reflectance over white has reached about 50% or greater at the absorption maximum) does the reaction proceed at the intrinsic rate of the colorant reaction. Only then do the chemical kinetics resemble those of the underlying “local” photochemistry and are not altered as a result of the “filter effect.” This finding is in accord with the recommended practice for investigating “local” photochemical reaction kinetics from measurements of overall reaction rates (Calvert and Pitts 1966, 640–42). In addition to the time dependence of the colorant loss for glazes, there is one other important prediction that comes from the assumptions built into this model. Since it is only the absorbance of the film (or equivalently, the amount of colorant) that enters into the model, this description implies that the details of the colorant distribution are irrelevant to the course of the fading. This relationship means that thick layers of dilute colorant should fade at the same rate as thin layers of more concentrated colorant, provided the absorbances are equal. Similarly, previously faded glazes (having a nonuniform concentration distribution) should fade at the same rate as unfaded glazes (with a uniform colorant distribution) having the same absorbance. 3.2 CHEMICAL KINETICS OF GLAZE FADING: COMPARISON WITH EXPERIMENTExperiments were performed on glazes of PR66 to demonstrate the extent to which this simple idealized behavior can be observed. This organic pigment was selected because it had been observed to be moderately fugitive upon exposure to visible light. The procedures are summarized in Appendix 2, and the results are shown in figures 4–6. Figure 4 shows the concentration loss in glaze 2, which prior to exposure absorbs essentially all of the light at the wavelength of maximum absorption (see fig. 1). The solid curves in figures 4a and 4b are calculated from the kinetic equation (7) described in Appendix 1. It can be seen in figure 4a that the rate of concentration loss is nearly constant with exposure—that is, the loss is approximately linear with exposure—until about 3 million footcandle hours (Mfchrs) dose, when the loss begins to decelerate markedly. In figure 4b the same data are plotted on a semilogarithmic scale, where it can be seen that the concentration loss after about 3 Mfchrs approaches an exponential decrease (i.e., linear on a semilogarithmic plot). This point at which the concentration loss begins to approach exponential behavior is also approximately the point at which the glaze becomes measurably less absorbing at the absorption maximum. Although only the results for glaze 2 are shown, the fading of the other glazes in the series shows the same general agreement with the predicted fading. Despite the relatively minor deviations from the ideal behavior, the overall course of the colorant loss seems to follow quite well the trends expected on the basis of the simplified kinetic model.
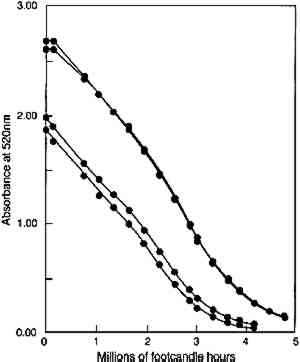
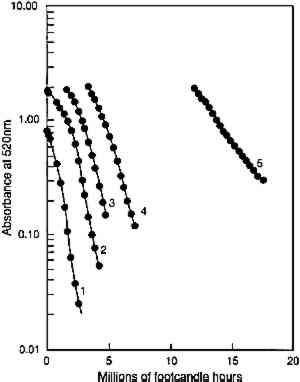
In figure 5, experimental results are presented that test the model prediction that the rate of colorant loss should depend only on the amount of light absorbed and not on the concentration distribution within the film. Pairs of fresh glazes were faded. Each member of the pair had similar absorbances, but one was made as a thin film When the same comparison is made of the fading of fresh, unfaded glazes and of previously faded glazes of the same absorbance, however, the results are not those expected on the basis of the model. Figure 6 shows the exponential fading of the set of glazes (i.e., linear colorant losses on a semilogarithmic plot), and it is clear that while closely matched glazes share nearly identical exponential decreases, the concentration losses are slower for those glazes that have experienced a greater amount of prior fading. The rate constants for this fading (i.e., the exponents of the exponential losses) are listed in table 2. When the darkest glaze (glaze 5) has faded to an intermediate absorbance of about 1, its further fading is only 20% of the rate of a fresh glaze (glaze 1) having an initial absorbance of 1. This behavior may illustrate the intuitive notion, based on some experience, that older colorants seem more resistant than fresh ones to further fading. TABLE 2. RATE CONSTANTS FOR EXPONENTIAL CONCENTRATION LOSSES SHOWN IN FIGURE 6 Despite these deviations from idealized behavior for very faded glazes, the experimental results presented here nevertheless suggest that the essential features of the photochemistry in a fading glaze are adequately included in the simple model described. While neglecting the details of the optics of the glaze, especially as it fades to create nonuniform colorant concentrations, the overall kinetics of the total concentration loss, and the resultant change in optical absorbance and reflectance, seem to be predicted well. This model also suggests, and the experimental results demonstrate, that for the simple glaze system described, fading will depend largely on the glaze's present color (or absorbance) and to a much lesser extent on the details of its formulation (specifically, its pigment loading). The experimental results do suggest, however, that the rate of fading may depend to some extent on the glaze's prior fading history. While the model presented above offers valuable insights into the photochemical kinetics of the glaze fading and provides important predictions of trends expected for simple systems, the most important measure of the light sensitivity of a glaze is still the rate at which its appearance changes from light exposure. In the next section we will explore how our picture of the underlying chemistry can help our understanding of the color changes that accompany the colorant losses. In particular, we seek trends that allow the identification of glaze applications that are at high risk of light-induced color changes and of the measurements that might provide the most useful indicators of those changes. |