FIBER-SAFE EXTRACTION OF RED MORDANT DYES FROM HAIR FIBERSERICA J. TIEDEMANN, & YIQI YANG
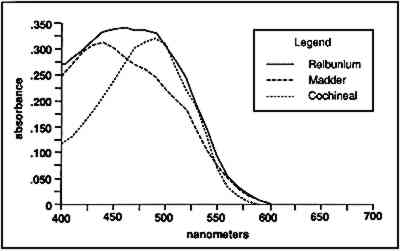
3 EXPERIMENTAL3.1 MORDANTING AND DYEINGApart from the solution concentrations and number of rinses, all wet-processing procedures followed the recipe that appears in table 1. Fabric for dyeing was Testfabrics wool gabardine fabric (worsted) no. 522. Specimens were cut with an area of 20 cm2 and dried weight ranging from 0.40 g to 0.45 g. Prior to mordanting, all specimens were boiled for a half an hour and rinsed three times in deionized water. TABLE 1 MORDANTING AND DYEING CONDITIONS The experiments were designed using an alum mordant because, of the mordants used in textile dyeing, aluminum has the lowest stability constant for complexes with EDTA (West and Sykes 1958). Therefore if the method is effective for aluminum-dye complexes, it should An alum mordant solution of alum 5.62 g/L and cream of tartar 1.87 g/L was made based on conversions from a dyeing manual (Adrosko 1971). After mordanting, the wool was not rinsed. Excess liquor was squeezed out of the wool, and it was allowed to dry. For dyeing, the dry, mordanted wool was placed directly into the dye liquor. Madder roots were cut into small pieces and soaked overnight in deionized water before Soxhlet extraction in water. The extract was then vacuum-filtered. Twenty g of extract were oven-dried for 4 hours at 50�C and then 2 hours at 100–105�C. The remaining solids were weighed to find the concentration of coloring matter, which was .04 g dye/g extract. (For the sake of convenience, the dried contents of the root and insect extracts will be referred to as “dye,” although it was quite clear that these contained impurities. Despite the inaccuracy, some frame of reference was needed for determining solution concentrations.) Dyebath concentration was 16g dye/L. Cochineal insects were crushed with a mortar and pestle and extracted with water in a Soxhlet. After vacuum filtering, 10 g extract were dried and weighed as above, giving a concentration of .05 g dye/g extract. Dyebath concentration was 2 g dye/L based on the dried weight of the extract. After dyeing, the fabrics were rinsed three times in deionized water and allowed to air-dry. 3.2 YARN EXTRACTIONFor a comparison of extraction concentrations, 5 cm long specimens were raveled from known dyeings of madder and cochineal. In preparation for extraction, the yarns were dried for 2 hours at 105�C and weighed to the nearest 0.1 mg. Twenty dried specimens from each dyeing were selected for tests of extraction concentration—10 tests of the HCl extraction and 10 tests of the EDTA-DMF extraction. The strong acid extraction was carried out according to the procedure used by Wouters in an extraction solution of water/methanol/37% HCl (1/1/2 v/v/v). Two mg dyed yarn were placed in a test tube with 1 ml HCl extracting solution. The test tube was placed in a boiling water bath for 10 minutes and then cooled rapidly in a cold water bath. The EDTA extraction solution consisted of 0.1% EDTA in water/DMF (1/1 v/v). Two mg yarn were extracted with 1 ml EDTA solution in a test tube for 30 minutes in a boiling water bath and then cooled rapidly in a cold water bath. Before extraction, fibers from the Peruvian yarns were examined under a microscope. One mg or less of yarn was extracted in 0.5 ml of the EDTA/DMF solution as above. For safety reasons, all extractions were carried out in a fume hood. 3.3 SPECTROPHOTOMETRYSpectrophotometry is most accurate at a wavelength of peak absorption. Because the chemicals studied here are colored compounds, they will have absorption maxima within the range of visible light. They also give strong, sharp peaks in the ultraviolet region for benzenoid and quinoid absorption. Although a sharp peak is ideal for measuring concentrations To make calibration curves of peak concentrations, a 50 ml extraction was run for both madder root extract and cochineal insect extract in each solution. Due to the scarcity of Relbunium root and Relbunium-dyed fabric and yarn, we were unable to run a comparison of extraction concentrations for it. The ratios for the HCl- and EDTA-extracting solutions were the same as those used in the yarn extractions. These extractions also followed the same extraction times as above. The cochineal insect extract solutions contained 0.025 g dye and 0.012 g alum. Alum content for the cochineal solutions was estimated based on the molar ratio of 1:2 (aluminum:carminic acid), assuming that all the dye was carminic acid. Such calculations were not possible for the madder root extract solutions because the root extract clearly contained more than just dye. Because of its comparatively low color strength in solution as well as on the dyed fibers, it was assumed that the madder solution would require less alum. Thus the madder solutions contained 0.10 g dye and 0.0096 g alum. As detailed in section 3.2, 10 2-mg yarn extractions were run for each dye in both extracting media. After heating, known solutions as well as yarn extractions were corrected by weight for evaporation. The contents of each flask and test tube were restored to their original masses with methanol for the HCl extraction and with deionized water for the EDTA/DMF extraction. All tests were run on a Hitachi U-2000 Spectrophotometer. To obtain the absorbance curves shown in figure 2, madder-, Relbunium-, and cochineal-dyed yarns were extracted in EDTA/DMF solution as above. The madder and cochineal yarn extracts were diluted with deionized water to show the curves at similar absorbance levels.
3.4 TENSILE STRENGTHFor the tensile strength tests, 20 warp and 20 filling yarns were selected randomly from the cochineal-dyed fabric. Yarn length was 5 cm. Ten yarns from each direction were reserved as the control sample. Ten yarns from each direction were extracted in EDTA/DMF solution as described above in two batches, warp and fill, with 0.5 ml solvent to each mg yarn. After extraction, yarns were rinsed three times in deionized water and dried at ambient temperature. A single fiber was selected from each yarn for testing, giving sample totals of 10 warp fibers and 10 filling fibers. Linear density was estimated for each fiber assuming cylindrical cross section from three diameter measurements according to ASTM D 2130-90 appendix (ASTM 1992a). Tensile testing was carried out according to ASTM D 3822-91 (ASTM 1992b). Due to mechanical failures, we were unable to condition the fibers to specifications. After diameter measurement, fibers were secured to tabs and “rested” for 24 hours. Tests were completed in one sitting at 72�F and 77% RH. |