FIBER-SAFE EXTRACTION OF RED MORDANT DYES FROM HAIR FIBERSERICA J. TIEDEMANN, & YIQI YANG
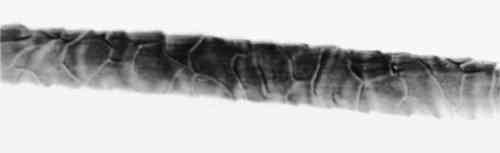
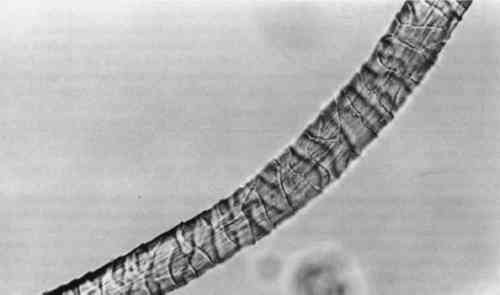
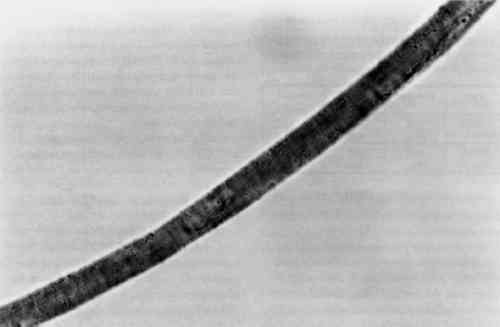
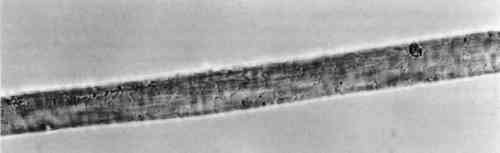
4 RESULTS AND DISCUSSION4.1 EXTRACTIONAlthough some yarn solids were recoverable from the HCl extractions, they were not readily recognizable as fiber material. On the other hand, using the EDTA/DMF extraction method, it was not possible to strip the yarns to their original color. Repeating the extraction yielded no more dye. Although visually, under fluorescent light, the initial color strength of the dyed madder yarns was as intense as the dyed cochineal yarns, after extraction the madder yarns were more heavily stained even when dry. Relbunium dyed yarns 4.2 SPECTROPHOTOMETRYFigure 2 shows the visible spectra of madder, Relbunium, and cochineal as extracted from wool yarn in 0.1% EDTA in water/DMF, pH 6.0. Despite incomplete extraction from the yarns, the three curves are readily distinguishable as in previous studies. Madder has a peak at 437.5 nm, Relbunium at 455.5 nm, and cochineal at 493.0 nm. The concentrations of the yarn extractions appear in table 2 along with peak absorbance (λ-max) and the correlation coefficient for the calibration curve (r2). Because we were interested in the colored compounds in the solution, we used the peak in the visible region of the spectrum for our estimation of dye concentration. Although it was clear that a large part of the solids, referred to as dye, were not dyes, especially in the madder root extract, the calibration gave nearly the same absorbance curves as the yarn extracts. Despite the impurities, these extractions were deemed acceptable references. Dye concentrations, as they appear in table 2 as g dye/g fiber, reflect the presence of other water-soluble substances in the root and insect extracts. TABLE 2 RESULTS OF DYED YARN EXTRACTIONS The concentrations of the fiber extracts did not compare entirely as expected. Although it left the yarn heavily stained, the EDTA extraction of madder-dyed yarn yielded more dye than the HCl extraction. Some explanation for The concentrations of the cochineal yarn extractions differed less than the concentrations of the madder yarn extractions. The HCl extraction yielded slightly more than the EDTA/DMF extraction at 0.13 g dye/g fiber compared to 0.11 g dye/g fiber. Unlike pseudopurpurin and munjistin, carminic acid, the main component of cochineal, has been shown to be very stable in 3 N HCl. Under these circumstances, where the HCl extraction is at its best—breaking up the mordant-dye complex and releasing dye from the fiber without also damaging the dye—it can be said that the EDTA/DMF performs comparably. 4.3 VARIATIONS IN ABSORPTION CURVESIn general, the peak absorption for the dyes is not always the same. Shifts in pH caused by new batches of chemicals can cause shifts in absorption curves. Given the expense of chemical waste disposal, workers may wish to recycle their DMF by distillation. If so, it is important to note that absorption curves for the dyes can vary greatly among fresh and recycled batches of chemicals. For example, in the absorption curve shown in figure 2, the peak absorption for cochineal is 493.0 nm, whereas the peak absorption found for EDTA/DMF extracted cochineal in the concentration tests for both the calibration solution and yarn extracts was 526.5 nm. The only difference between these tests was the DMF in the extraction solutions: the first was fresh DMF and the second was recycled DMF. According to the DMF label, there are 0.0004% titratable acids in the solvent. After recycling this DMF will have a higher pH than at the outset because it will have been purified of any mineral acids in the original batch. The EDTA solution with fresh DMF had a pH of 6.0, and the solution with recycled DMF had a pH of 6.5. As pH increased, the dyes showed a bathochromic shift. Hence workers should be wary that absorption maxima may vary even within their own laboratories. 4.4 FIBER SURFACE STRUCTUREFibers for micrographs were mounted in deionized water and observed under an Olympus BH2-RFCA light microscope. Figures 3 and 4 show two fibers from the same piece of cochineal-dyed cloth. The fiber in figure 3 is before extraction, and the fiber in figure 4 has been extracted by the EDTA extraction method. The extraction has not destroyed the characteristic wool surface structure. Hence the fiber may still be used for other analysis or mounted permanently for future reference.
Although the wool yarn was not completely dissolved after HCl extraction, it was no longer retrievable as fiber. Instead, there were small fragments of fiber floating in the solution, and 4.5 TENSILE STRENGTHThe results of the single fiber tensile strength tests appear in table 3. Tenacity is given in g force/denier, and the standard deviation for each group of tests is given in the far right column. These results are expected to indicate effects that the treatment might have on the molecular structure of the fiber. Clearly, the EDTA extracted fibers show some loss of tensile strength. After processing at 100�C for 30 minutes, some deterioration is to be expected. Nevertheless, the fibers had good retention of tenacity considering that the alternative is destruction. TABLE 3 RESULTS OF SINGLE FIBER TENSILE STRENGTH TESTS 4.6 PERUVIAN YARN EXTRACTIONSThe sources of red yarns taken from the Krannert Art Museum collection of Peruvian textiles include the red fringe of a border fragment All of the yarns were quite brittle. Under the microscope, most fibers had visible scales and discontinuous medullas. Surface structure on the South Coast Wari headband fibers was The extraction proceeded for these fibers much as it did in the wool tests. Fresh DMF was used. After 30 minutes in the boiling water bath, the dye had been released into solution and the fibers remained pink and intact. Before measuring the absorbance of the Peruvian yarn extracts, the 0.5 ml solutions were diluted with 1 ml deionized water. Absorbance curves of the extracted dyes all matched the cochineal reference curve. EDTA/DMF extraction left the microscopic surface structure of the fibers unchanged and in some instances slightly improved. Figures 5 and 6 show fibers from the Paracas Necropolis border fragment before and after extraction. Although the surface scales are evident in these micrographs, the best assessment of the fiber surface is accomplished on the microscope by shifting the plane of focus through the fiber.
Altogether, the EDTA/DMF extraction of the ancient Peruvian red yarns was successful and nondestructive. |