NATURAL AGING OF PHOTOGRAPHSSTANTON ANDERSON, & ROBERT ELLISON
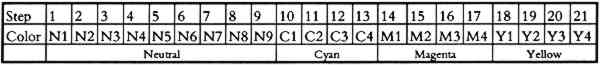
3 EXPERIMENTAL PROCEDUREA special team, called Team Tortoise, conducts the natural-aging tests at Eastman Kodak. Essentially the same procedure has been employed since the initiation of our long-range testing program many years ago. Although some special tests look at such things as processing and enclosure effects, most tests are run on standard products. As new products evolve, tests are initiated using selected product. The chosen film or paper is exposed to test charts (fig. 4) and processed through the appropriate standard processing chemicals and conditions. A test chart is designed to produce patches of minimum densities (D-min) and neutral densities as well as cyan, magenta, and yellow patches to evaluate the individual image dyes. The chart includes a series of exposure steps that will bracket 1.0 density so that, after the densities of all steps are taken, they can be used in a mainframe computer to produce a smoothing curve across the range of densities and then to locate the exact 1.0 density, our point of reference for evaluation.
After exposure, processing, and densitometry, the samples are packaged for keeping. The controls are sandwiched between polyester sheets, wrapped in aluminum foil, and sealed in a polyethylene lined bag made of aluminum foil at 40% RH. The packaging procedure for freezing also includes the use of a roller to remove air and an electric iron to heat seal the bag. Care is taken to place the sample in the freezer only after the sample is fully sealed. A frozen control sample is opened from conditioning for readings only after being equilibrated at room temperature for at least 3 hours. The 24�C/40% RH and 26�C/60% RH samples are packaged in individual envelopes (another type) lined with black paper to prevent irradiation from ambient light. The envelopes used have been analyzed and found to contain no harmful chemicals. Spectrophotometry, chromatography, and other methods were used to identify organic and inorganic compounds that might cause problems. The enclosures were found to be chemically inert in terms of oxidants, reductants, solvents, acids, or bases, sulfur, and other materials that might affect the After a measured period of keeping, usually 1 or 2 years, all samples are retrieved from incubation, removed from packaging, and reread by status A or M (as appropriate) densitometry. Status A and M refer to filters used in the densitometer. Status M is used for negative films that are printed; status A is used for other products. We use optical density because it expresses how a photographic image absorbs light and is close to the manner in which the eye or a printer sees the differences. The formula used to calculate density is D = −logT where T is transmittance. We use a smoothing curve in the computer to calculate the exact changes at desired densities. The measured values are then compared to the original readings, and the differences at designated density levels are plotted against time. The levels of interest are generally B-min, 1.0 neutral, 1.0 cyan, 1.0 magenta, and 1.0 yellow. B-min refers to the D-min–(minimum density) patch read through a blue filter showing yellow staining in the highlights. Of most interest is the response of the D-min corrected values for the cyan, magenta, and yellow dyes. These generally show the first detectable changes and give us an early clue concerning the imaging dyes and the resulting overall stability of the product. D-min corrected image dyes can be explained as follows: Historically, color products have been analyzed for blue-light color separation (yellow dye), with the change in minimum density after incubation subtracted from the change in the patch. Thus, if the gross density change in the yellow patch is −0.20 density units and the change in the minimum density patch is +0.10, the net change in the yellow dye is calculated to be −0.30. Any changes in the red and green densities are treated in a similar fashion, although the largest changes usually occur in the blue density (yellowing). Data are plotted for each of the two roomlike conditions, 24�C/40% RH and 26�C/60% RH, as well as at −23�C (the control). When desired, we can also generate full sensitometric curves showing a comparison of the original curve to the resulting sensitometric curve at some point in the aging process. The control is used to give us some comparison since it provides an indication of the variability in measurement that is not product related in these long-term tests. This comparison is important since the length of time presents problems that are not present in the more common short-term testing. While variability in densitometry, handling, and keeping accumulates over a long period, mild conditions and repeated measurements aid in obtaining meaningful data. Crossover measurements are made when old densitometers are retired and new ones introduced. Samples are often run in replicate, and tests are combined in studying the results. The exact number of replicates is usually two but varies with the individual test. Within a test, the number of replicates per condition is the same. Over the years the number has varied from 1–5, depending on the designer, the material available, and so on. Many replicates are desirable, but the greatest advantage comes from pooling many |