NATURAL AGING OF PHOTOGRAPHSSTANTON ANDERSON, & ROBERT ELLISON
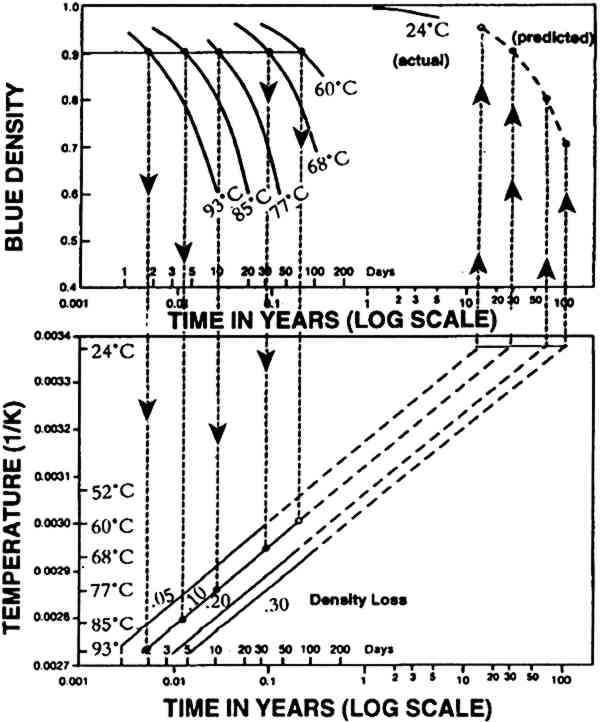
2 ARRHENIUS TESTINGFor this paper it is useful to review the method for Arrhenius testing (Eastman Kodak Company 1988). At room conditions (approximately 24�C [75�F] and 40% RH), significant changes occur in color materials only after a long period of time. For this reason, it is difficult to obtain timely information on the stability of a product by evaluation at the actual keeping conditions. We can, however, predict the long-term density changes expected to occur in color materials by performing short-term tests at a series of high temperatures. In practice, samples of a given product are exposed and processed according to current recommendations to provide dye patches (see section 3) at densities of 1.0. These samples are stored in the dark at 40% RH for various lengths of time at temperatures ranging from 52�C to 93�C (126�F to 199�F). Samples are removed at appropriate time intervals to make density measurements. The method of predicting dark-keeping changes can be understood by examining the graph in figure 1. The relationship between keeping temperature and the time required to produce various degrees of fading is shown. The solid curved lines illustrate the blue density of the associated yellow dye at various temperatures during the Arrhenius test. The time (log scale) to obtain a specific density change for each of the temperature curves is replotted
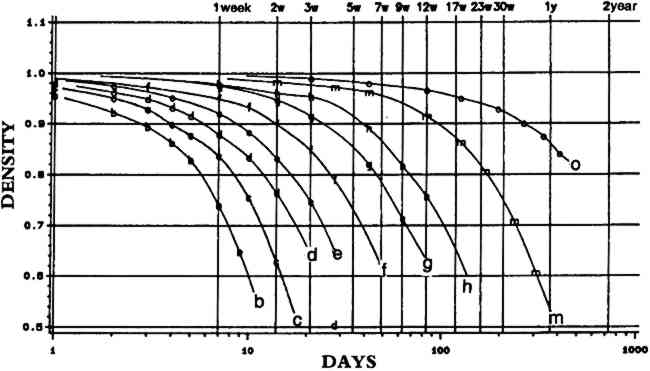
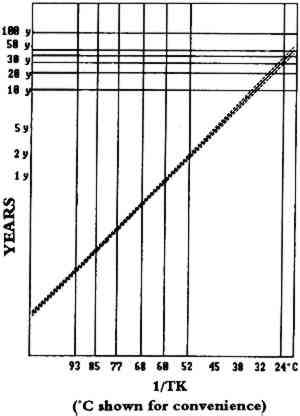
The full value of Arrhenius testing, however, cannot be determined at this time because we do not know how accurate the predictions are. Figures 2 and 3 show Arrhenius data for KODAK VERICOLOR III Professional Film, type S. Figure 2 shows waterfall plots of the fading of the yellow dye across the series of temperatures shown at the bottom of the plots. The points appear to fall well on the lines, and the various temperatures show even spreads from one another and are smooth and similar in shape. In figure 3, the plots of the time for a 10% loss at the various temperatures form a well-behaved line with a 95%-confidence interval represented by the dotted lines, which are tight. We use a 10% change as an analytical tool
Eastman Kodak Company has been conducting long-range or natural-aging tests for more than 20 years using carefully controlled conditions that simulate average use and storage. The Image Stability Technical Center, the repository for samples in this important study, contains a wide variety of film and paper products of various ages, both black-and-white and color. In this continuous study we monitor densitometry changes on products over time in controlled dark-keeping conditions. The conditions include a control at −23�C in addition to 24�C/40% RH and 26�C/60%RH. Fortunately, these conditions, which were selected many years ago for natural aging, are in good agreement with recent studies carried out to estimate actual conditions of use. In a Kodak study conducted in 1981 (Anderson and Larson 1987), we collected data on temperature and humidity continuously for the full year in two homes in Rochester, New York. The yearly averages were 50% RH and 21�C (70�F). Our test humidities (40% RH and 60% RH) bracket the 50% RH level, while the test temperatures (24�C and 26�C) are a few degrees higher than what we found in the homes. We do not know how these test conditions were chosen. However, it is fortunate that they appear to be more stringent than the average conditions found in homes, thereby ensuring that we will not miss any changes that might occur in actual use. The fluctuations in temperature and humidity are, however, not taken into account. More work is needed to determine if fluctuations are a factor. |