EXPOSURE OF DEACIDIFIED AND UNTREATED PAPER TO AMBIENT LEVELS OF SULFUR DIOXIDE AND NITROGEN DIOXIDE: NATURE AND YIELDS OF REACTION PRODUCTSEDWIN L. WILLIAMS, & DANIEL GROSJEAN
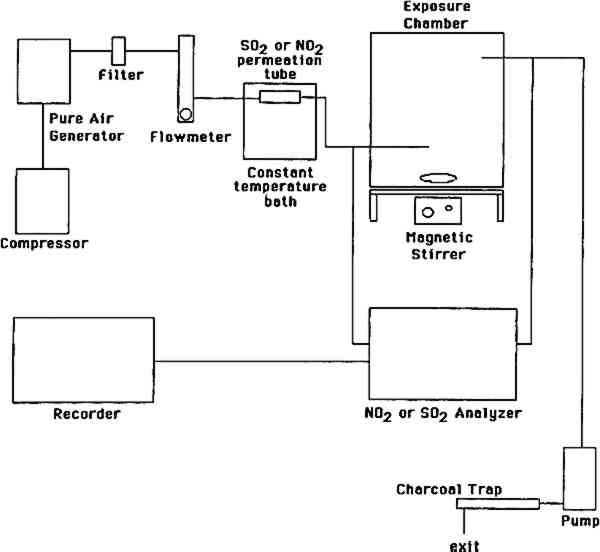
2 EXPERIMENTAL METHODS2.1 EXPOSURE CHAMBERSThree identical cube-shaped exposure chambers were constructed, each made of six sheets of 35.6 cm � 0.63 cm thick polymethyl methacrylate (Acrylite FF). The chamber volume was 45 I and its surface-to-volume ratio was 16.9 m−1. Five sides of the chamber were sealed permanently with acrylic plastic cement (Weld-On); the sixth (top) panel could be removed for handling of paper samples. A 29 cm wide external collar coated with high-vacuum Teflon grease provided a leak-proof seal between top and side panels. The chamber was lined inside with clear FEP Teflon film (Dupont 200 A), using double-sided tape (Scotch 665). Two small Piexiglas ports, inlet and exit, each 0.63 2.2 PAPER TYPES AND DEACIDIFICATION PROCESSESTwo types of paper were tested, white wove and newsprint. They were identical to those recently studied by Daniel et al. (1990) at much higher levels of SO2. The white wove was 100% bleached chemical pulp book paper, sized with rosin and starch and coated with clay. The newsprint was 60% mechanical pulp–40% bleached chemical pulp paper without any sizing or coating. Both paper types were tested (1) untreated, (2) deacidified in an aqueous solution, and (3) deacidified in a nonaqueous solution. Whatman paper (100% cellulose) and Teflon filters were also included for comparison. Nonaqueous deacidification was carried out with a 50:50 solution of Wei T'o solution 3 and reagent alcohol. Wei T'o solution 3 contains methyl methoxy magnesium carbonate and volatile organic solvents. The solution was brushed onto the paper vertically and horizontally, saturating the paper, with the paper under vacuum on a suction table and a clean blotter between the paper and the table surface. The paper was allowed to dry under vacuum before removal from the table. Aqueous deacidification was carried out in a solution prepared by bubbling carbon dioxide through a solution of 200 g magnesium carbonate in 15 gal deionized water. The paper sheets were soaked for 3 hours in this solution and allowed to dry in air overnight. Both deacidification processes provided the paper with an alkaline reserve in the form of magnesium carbonate. Finally, deacidified and untreated paper samples were cut into 4 � 4 cm squares and suspended in the exposure chambers in an evenly spaced 9 � 5 � 5 matrix using mercerized cotton thread connected to small plastic hooks. These hooks were cut from 0.5 cm long sections of 1.3 cm outside diameter Plexiglas tubing and were cemented on opposite sides of the exposure chambers. 2.3 AIR POLLUTANT SOURCES AND MEASUREMENT METHODSThe experimental apparatus is schematically shown in figure 1. SO2 and NO2 were obtained from permeation tubes (VICI Metronics) kept at constant temperature (30.0 � 0.1�C) in a water bath. A nylon filter was inserted downstream of the NO2 permeation tube to remove nitric acid, if any. Particle-free, purified air was obtained by passing room air through large beds of silica gel, Purafil (permanganate and alumina), activated carbon, and a glass fiber filter. Silica gel, while contributing along with carbon and Purafil to the removal of air pollutants, also acted as a “buffer” of the matrix air humidity. The mean daytime relative humidity (RH) and temperature for the exposures to purified air, to SO2, to NO2, and to the SO2 + NO2 mixture were 63 � 11, 57 � 8, 62 � 7, 62 � 7 % and 19 � 2, 21 � 2, 19 � 2, 19 � 2 �C, respectively. Temperature and RH readings were not taken at night. Actual mean temperature and RH were probably somewhat higher and lower, respectively, than the daytime averages given above.
The purified air thus obtained was used as the matrix air for dilution of the permeation tubes Throughout the exposures, SO2 and NO2 were measured at the chamber inlet and exit using calibrated continuous analyzers. SO2 was measured by pulsed fluorescence (Monitor Labs 8850) and NO2 was measured by chemiluminescence (Monitor Labs 8840). Both instruments were calibrated using certified permeation tubes according to U.S. Environmental Protection Agency-approved methods. Control experiments were carried out to assess removal of SO2 and NO2 by the empty Teflon-lined chambers. The empty chambers removed only 5% of the inlet SO2 and NO2 concentrations. 2.4 PAPER EXTRACTION AND LIQUID CHROMATOGRAPHY ANALYSISPaper samples were withdrawn from the chamber every week or every other week, placed in vials containing 4 ml of deionized water and 16 μl of HPLC-grade chloroform as a biocide, and stored at refrigerator temperature. The addition of a biocide is critical to sample stability, as nitrate is rapidly consumed by bacteria. The samples were extracted by sonication for 20 minutes; 1.5 ml aliquots were filtered over a 0.2 μm pore-size, 4 mm diameter nylon syringe filter and were stored refrigerated in glass vials sealed with Teflon-lined screw caps. Control samples (unexposed paper stored refrigerated in the dark) and the corresponding blanks (vials containing only deionized water and chloroform) were included in all cases. Samples were analyzed for nitrite and bisulfite by liquid chromatography with ultraviolet Samples were analyzed for nitrate and sulfate by liquid chromatography with indirect ultraviolet detection at 275 nm as is described in detail elsewhere (Williams and Grosjean 1990). The method involves separation on a low-capacity anion exchange column (Hamilton PRP-X-100) with dilute sodium benzoate eluent (5 mM sodium benzoate, eluent flow rate 1.0 ml/min). Calibration involved the use of external standards (i.e., dilute solutions of sodium nitrate and sodium sulfate in deionized water). Analytical detection limits are 75 and 90 ng for nitrate and sulfate, respectively, for 100 μl injections. These limits correspond to detection limits of 3 μg per paper sample for nitrate and 6 μg per paper sample for nitrate and 6 μg per paper sample for sulfate. Multiple injections of standard solutions yielded RSDs of 3.5% and 2.6% for nitrate and sulfate, respectively. Replicate analysis of paper samples yielded RSDs of 13.9% for nitrate (range = 0–100%, 17 sets of replicates) and 10.1% for sulfate (range = 0–75%, 17 sets of replicates). Samples located next to the pollutant inlet generally contained more sulfate, nitrite, and nitrate than those at other locations within the chamber. With the exception of these samples, anion concentrations in extracts from a given type of paper, deacidification method, and exposure duration appeared to be randomly distributed, thus indicating reasonable mixing of SO2 and NO2 throughout the exposure chamber. 2.5 EXPOSURE PROTOCOLFour separate exposures were carried out, one to purified air containing no detectable amounts of SO2 and NO2 (control), one to purified air containing SO2 (87 ppb), one to purified air containing NO2 (92 ppb), and one to purified air containing both SO2 (108 ppb) and NO2 (98 ppb). The durations of the exposures to purified air, SO2, NO2 and SO2 + NO2 were 11, 29, 13, and 13 weeks, respectively. |