TECHNICAL EXAMINATION OF RENAISSANCE MEDALS THE USE OF LAUE BACK REFLECTION X-RAY DIFFRACTION TO IDENTIFY ELECTROFORMED REPRODUCTIONS
Glenn Wharton
5 METAL IDENTIFICATION BY LAUE BACK REFLECTION X-RAY DIFFRACTION
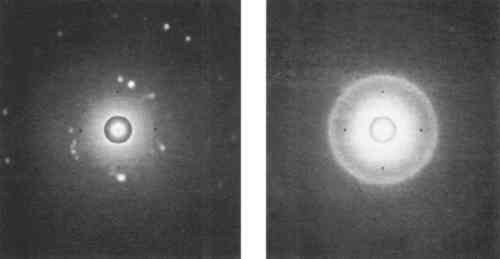
THE CIRCULAR PATTERNS of spots on Laue photographs are called “Debye rings.” They are produced by the diffraction of X-rays from the crystal lattice of the specimen as determined by Bragg's law. The angles of diffraction and the size of the resulting Debye rings are characteristic of the metal being examined. The specific metal can therefore be identified by determining these angles of diffraction (which are given the symbol θ.) The following discussion on how to identify the metal has been simplified for the purpose of this paper. A better understanding of the process may be obtained from any general text on X-ray diffraction.
θ for each Debye ring may be calculated by determining the tangent for the angle 180–2θ using the following equation. The symbols θ, r2, and D are defined in Figure 10. After solving for θ for each
Fig. .
 |
ring on the photograph, the metal may be identified by comparing the values to those tabulated in an atlas of powder X-ray diffraction data (Table 1).20 The d spacing of the crystal lattice may also be calculated by solving for d in Bragg's law:
Fig. .
 |
In this equation, λ is the wavelength of radiation (1.54 � for nickel filtered copper Kα radiation), d is the spacing characteristic of the metal specimen, and θ is the angle of diffraction. d values can also be found in powder diffraction data tables (Table 1).
Fig. 10.
The back reflected X-rays from the medal create Debye ring patterns on the film. In this diagram, 2θ is the angle of back reflected diffraction, r2 is the radius of the resulting Debye ring, and D is the distance from the medal to the film, in our case a constant three centimeters.
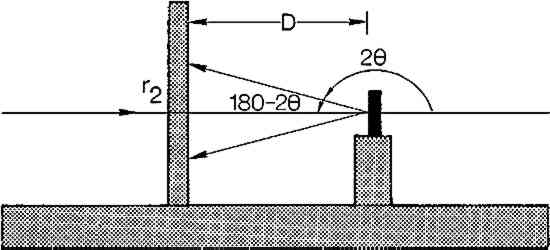 |
Table 1. Copper X-ray powder data for copper Kα radiation. I represents the intensity of the diffracted beam, θ, the angle of diffraction, and d, the spacing of the crystal lattice. (From the Peacock Atlas of X-ray Powder Data for Ore Minerals.)
Fig. .
 |
|