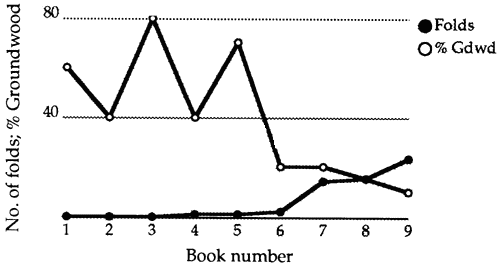

The graph below is compiled from published test data on strength and groundwood content of naturally aged book papers. The numbers on the x-axis are those assigned to the books in order of increasing MIT fold number (at 1/2 kg tension). The values for fold and percent groundwood are plotted (rather unconventionally) in two lines that cross, to illustrate the negative correlation. The graph shows that none of the papers containing more than 20% groundwood had any strength left at all by the time they were tested in the mid-1960s.
Strength for these nine papers is not correlated with age. The three strongest book papers (7, 8 and 9) were published in 1893, 1892 and 1887. The six weakest book papers were published over that same period (1892, 1887, 1887, 1886, 1870 and 1870).
Although the strongest book papers have a higher pH (5.7, 5.8, and 5.5) than the others (3.8-4.6), their strength cannot be explained at this late date by their higher pH, because all of the papers have become more acidic, at their own rate, over time. Low pH in paper is a result, as well as a cause, of degradation. We have no way of knowing exactly what the initial pH was, so we can only guess how it influenced the initial degradation of these papers.

Groundwood content vs. fold (uninked portion of the page, average
of cross-print and with-print directions) for the nine books that
contained groundwood, 1870-1893, in the Barrow Laboratory's
publication, Strength & Other Characteristics of Book
Papers 1800-1899, Table 12 (Permanence and Durability of the
Book 5). Fold is MIT fold number at 1/2 kg tension.