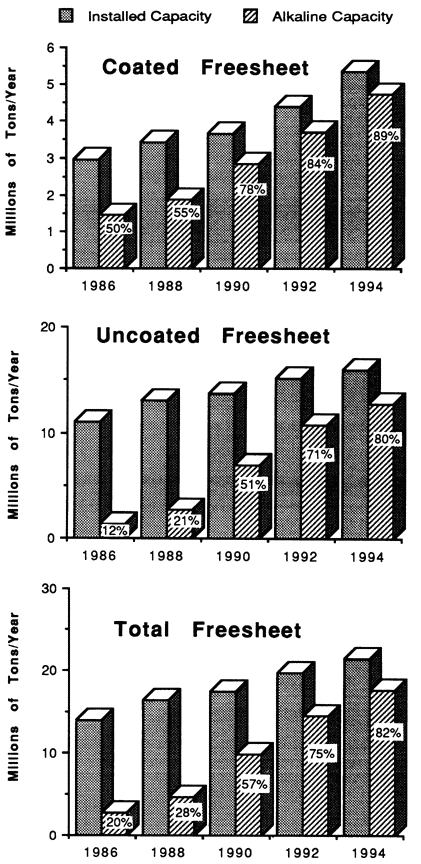
The bar graphs below were constructed on the basis of figures supplied by Pfizer's Specialty Minerals Group. They refer to U.S. productive capacity, not to actual production, which varies from month to month.
[Search all CoOL documents]

![[Contents]](/byorg/abbey/ap/img/contbtn.gif)
![[Search]](/byorg/abbey/ap/img/srchbtn.gif)
![[Abbey]](/byorg/abbey/ap/img/abbbtn.gif)