TECHNICAL STUDY OF ETHIOPIAN ICONS, NATIONAL MUSEUM OF AFRICAN ART, SMITHSONIAN INSTITUTIONErica E. James
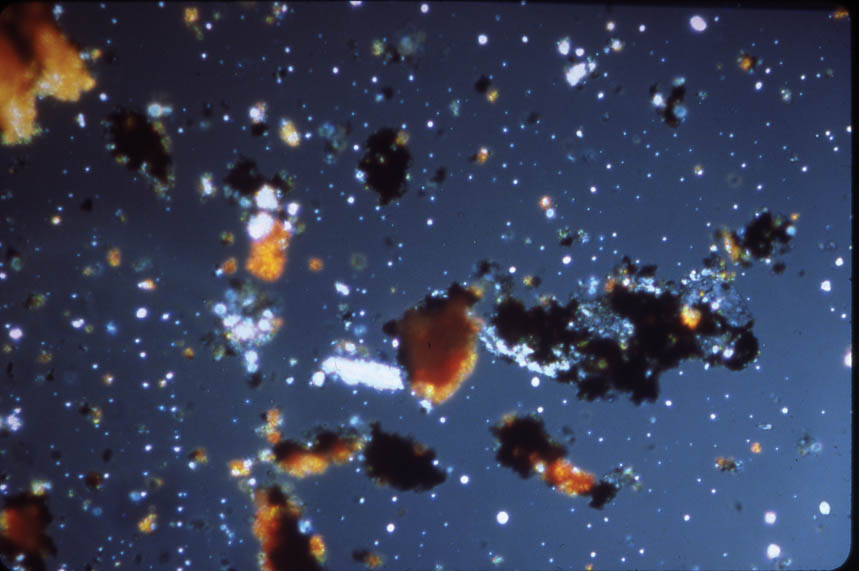
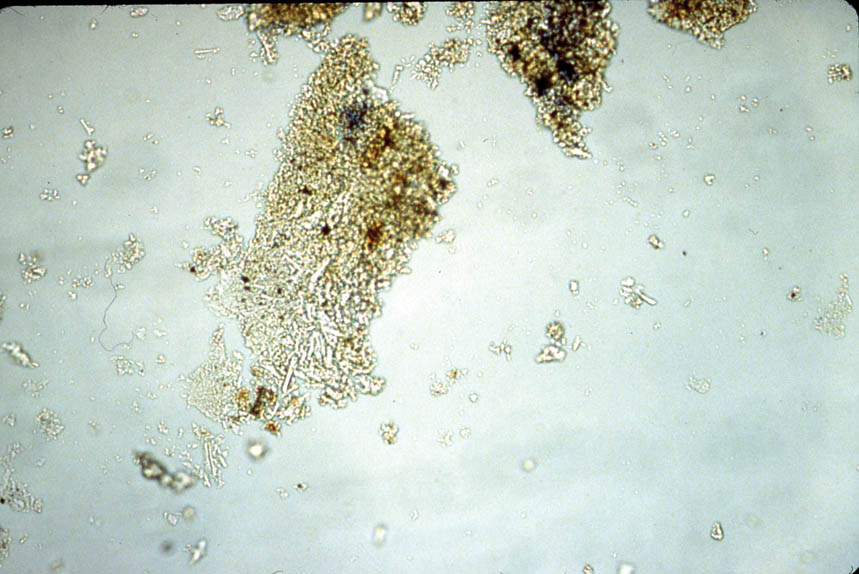
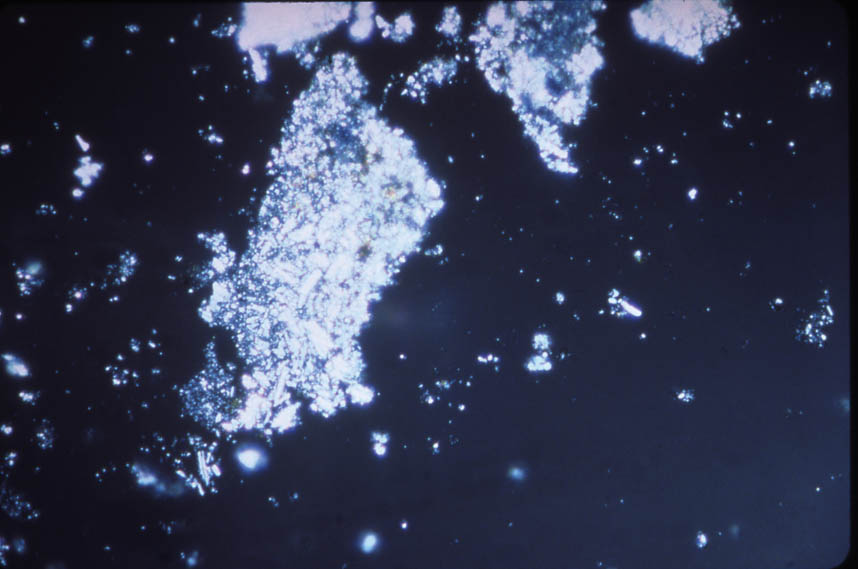
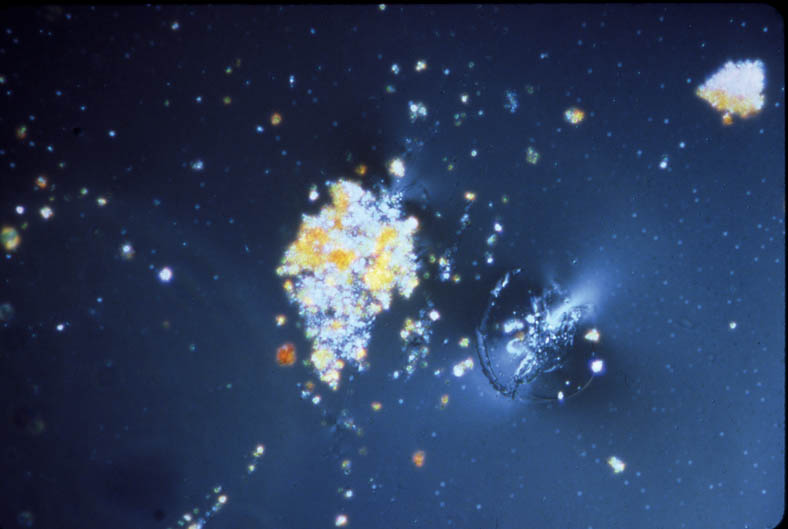
4 TECHNICAL STUDY: EXAMINATION OF PIGMENTSPrior to this technical study, some technical notes on the pigments used for Ethiopian icons had been published (Weihs 1973). To understand each palette, representative colors were sampled on each icon. The individual icons were considered as whole units; thus it was not deemed necessary to sample each panel in a diptych or triptych. 4.1 POLARIZED LIGHT MICROSCOPYThe pigments were examined with dispersed pigment analysis, and each pigment sample was compared to a reference slide. Photomicrographs of dispersed pigments samples are shown in figures 4–7. Pigment samples were removed with a scalpel or needle and mounted with Meltmount mounting medium (refractive index 1.662). The pigment samples were analyzed using the NMAfA Zeiss Axioplan Pol Universal polarized light microscope using transmitted light in bright field and crossed polarization with a magnification range of 100 to 1000x. Polarized light microscopy revealed a consistent palette (table 2): cinnabar (HgS) to create red; orpiment (arsenic trisulfide, As2S3) to create yellow; indigo (C16H10N2O2) to create blue; a mixture of orpiment and indigo to create green; gypsum
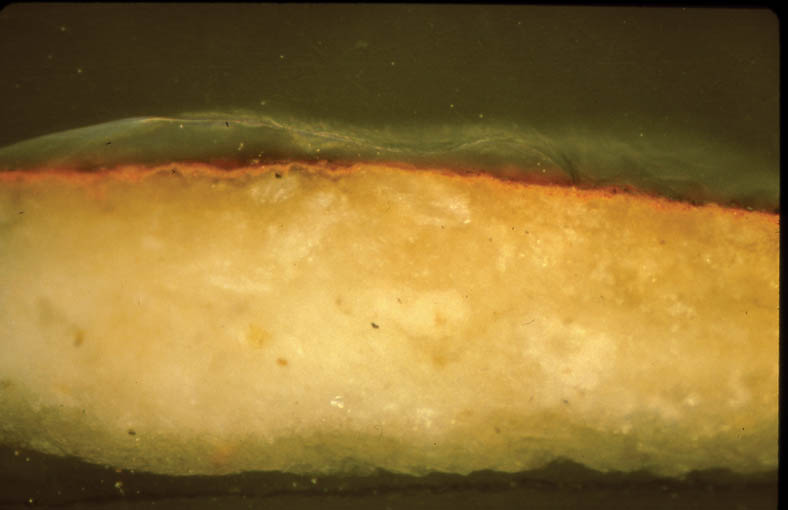
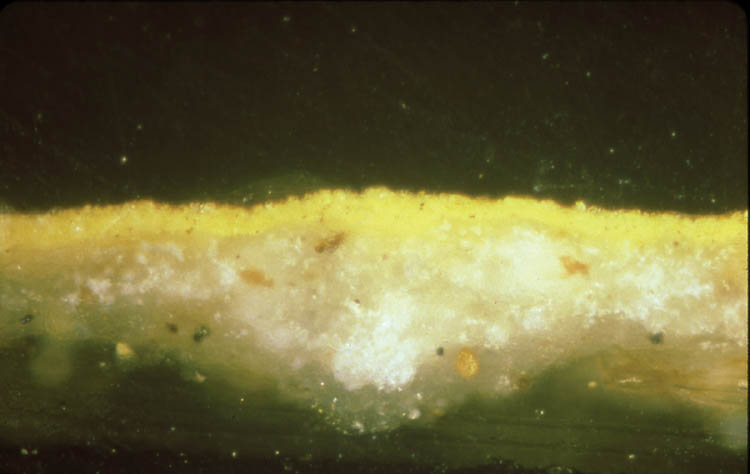
In addition, cross sections mounted in Bio-Plastic polyester resin were examined in order to understand the construction of the paint layer. Figures 8 and 9 are photomicrographs from acc. nos. 98-3-1 and 98-3-2. They both demonstrate the basic direct layering technique used by the icon painter. Figure 8 has a ground layer composed of gypsum and a paint layer composed of cinnabar. Figure 9 has a ground layer composed of gypsum and a paint layer composed of orpiment. 4.2 SCANNING ELECTRON MICROSCOPY WITH EDS CAPABILITIESBoth loose samples and cross sections were then prepared for analysis utilizing scanning electron microscopy with energy dispersive spectroscopy. The SEM instrumentation used in analysis was a JEOL JXA-840A scanning electron microscope with a Tracor Northern (now Noran) TN-5502 energy
In sampling the icons for SEM analysis, cross sections were taken from areas that had the most colors converging in one area. If a color was missed, then a loose fragment was removed for analysis. Despite this consideration, only some of the pigments were able to be isolated for each sample. The SEM-EDS pigment identification results are detailed in table 3. SEM-EDS confirmed the presence of elements that are indicative of cinnabar (mercury and sulfur), orpiment (arsenic and sulfur), and gypsum (calcium and sulfur). The variations to these results included a red sample from acc. no. 98-3-3 with a high organic content, indicating the possibility of a red dye. This result was supported by the PLM identification of madder. Black, green, and blue pigments are difficult to determine by SEM-EDS when their coloration is due to organic compounds. In green areas of the icons, most of the colors described are optical mixtures utilizing orpiment, indigo, and an unspecified earth brown that, depending on the amount added, deepens the green hue. Only in acc. no. 94-21-1 is a pure green pigment, terre verte or green earth, observed and only within a mixture of the other colors. Oral history research indicates that
4.3 X-RAY FLUORESCENCEThe blue areas of the icons were complex in their identification. Although the majority of the blues were indigo, smalt was observed in acc. no. 94-21-1. An attempt was made to confirm the presence of cobalt, the coloring component of smalt, utilizing x-ray fluorescence at the Freer/Sackler Conservation Laboratory. The XRF instrumentation used was the Omega Five x-ray fluorescence instrumentation (a modified Spectrace 6000) with an open-beam architecture. The tube voltage and current were 30 kV and 0.99 mA, respectively. The x-ray beam was directed at the robe of the Virgin Mary. No cobalt was observed in the spectrum of the blue in acc. no. 94-21-1, but the observation of smalt was isolated to one dispersed pigment sample of a pale blue colorant taken from the robe area. Thus, smalt was not the primary 4.4 FOURIER TRANSFORM INFRARED SPECTROSCOPYThe second question in the blue portions of the icons concerned the possible presence of Prussian blue. PLM indicated the possible presence of Prussian blue in the blue paint samples of acc. nos. 98-3-1 and 73-24-1. Since indigo was seen primarily in the other icons, the possible presence of Prussian blue was unexpected. It is difficult, however, to differentiate Prussian blue from indigo using PLM due to their similar optical characteristics, and a precise identification was not possible. Samples from blue areas in all of the icons were analyzed by Fourier transform infrared spectroscopy (FTIR) analysis. The FTIR instrumentation used in analysis was a Mattson 4326 Upgrade Fourier Transform Infrared Spectropho-tometer/SpectraTech IR Plan microscope. The spectra were scanned at 16 or 8 wavenumbers resolution for varying times—3 to 12 minutes. The carbon-nitrogen triple bond (cyano group) of Prussian blue has a distinct absorption at 4.8 microns (2085 wavenumbers). This absorption was observed only in acc. no. 98-3-1. In addition, acc. no. 98-3-1 tested positive for Prussian blue during spot testing1. Prussian blue was not detected in acc. no. 73-24-1 by FTIR analysis or spot testing. The spectra for both of the blue samples indicated two absorption bands in the 1450 to 1500 wavenumber region. Indigoid dyes tend to have two absorption bands in this region. Two such absorption bands are detectable in five of the samples, with the exclusion of acc. no. 98-3-3. The sample for acc. no. 98-3-3 was too difficult to isolate from other materials and impurities in the sample, and so neither Prussian blue nor indigo was detectable. A summary of the FTIR results for the blue pigments is presented in table 4. 4.5 X-RAY DIFFRACTIONThe final question in the blue portions of the painting was the possible detection of ultramarine by PLM in acc. nos. 98-3-1 and 73-24-1 by SEM. This pigment was not observed initially in multiple dispersed pigment samples of blue pigment from
For XRD analysis, each sample was mounted onto the tip of the glass fiber with a rubber cement–toluene mixture. The samples were run on a Philips PW-1820 spectrometer with Ni-filtered Cu K (alpha) radiation at 45 kV and 45 mA for six hours each. Kodak DEF-392 direct exposure film was used to record the diffraction patterns. XRD analysis of these samples showed no evidence of ultramarine. |