EFFECTS OF ENCLOSURE PAPERS AND PAPERBOARDS CONTAINING LIGNINS ON PHOTOGRAPHIC IMAGE STABILITYDANIEL M. BURGE, JAMES M. REILLY, & DOUGLAS W. NISHIMURA
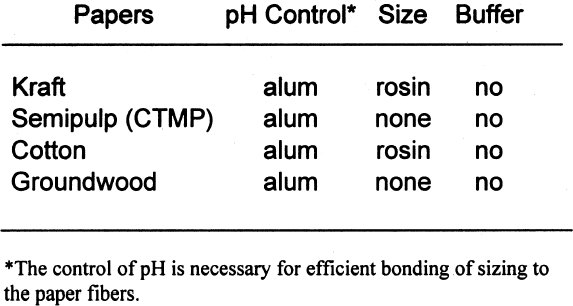
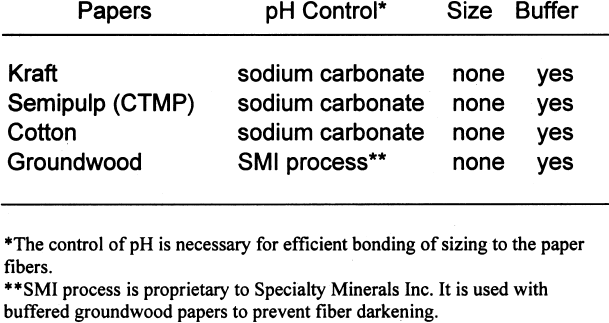
2 SAMPLE PREPARATION2.1 PAPERSIn the mid-1990s, a project conducted by the Institute for Standards Research of the American Society for Testing and Materials (ASTM) and sponsored by several paper companies produced papers of known composition in order to examine the effects of paper ingredients on paper longevity. The Image Permanence Institute (IPI) at the Rochester Institute of Technology was contracted to perform pollution exposure tests on the papers as part of the larger project. The availability of these special papers provided a rare opportunity for IPI to test the effects of paper ingredients on photographic materials. ASTM was gracious enough to provide a few sheets of each paper type for these tests. The overall design of the study was to characterize the paper samples using well-established analytical methods and then measure the effects on photographic materials. The majority of the tests performed for this project were done using a set of eight papers of controlled, varied composition. The variations were in pulp type, sizing, and buffering. The pulps used were cotton, bleached softwood kraft, bleached softwood chemical-thermal-mechanical (CTMP), and groundwood. Kraft pulps were fully purified to remove all measurable traces of lignins. The CTMP is a semipulp, so while most of the lignins were removed, some still remained. As mentioned above, groundwood pulp is produced by the mechanical grinding of logs. Most of the lignins present in the wood before grinding are present in the resulting pulp. Alum (aluminum sulfate)-rosin sizing was used in The first set of tests performed was a simple
The presence of lignins was determined by using the phloroglucinol spot test. The solution for the test consists of 1 g phloroglucinol in a mixture of 50 ml of water, 50 ml of methyl alcohol, and 50 ml of concentrated hydrochloric acid. Applying a small drop of the solution to the surface of the paper or board will turn any ligneous fiber dark purple. The depth of the color change in the test area is proportional to the amount of lignins present. For the pH test, approximately 1 g of the material was placed into a 250 ml flask. Seventy ml of distilled water with a pH of 5.9 or higher was added to the sample. The samples were then allowed to soak for one hour. The pH was then measured with a Beckman pHI 40 pH meter. Two replicates of each paper were tested, and the results were averaged. Note that the standard allows the distilled water to have a slightly acidic pH. This allowance is due to absorption of carbon dioxide (CO2) from the atmosphere. When samples of an acidic or alkaline nature are tested, this slight acidity of the water should have a negligible effect. However, it does become difficult to accurately measure samples having a pH close to that of the test water. The alkaline reserve test used here is a modified version of ASTM D 4988–96 determination of alkalinity of paper as calcium carbonate (alkaline reserve test of paper) (ASTM 1996). Approximately 1 g of the material was placed in a flask. Added to the flask was 70 ml of distilled water. The mixture was allowed to soak one hour with occasional agitation. After soaking, 25 ml of 0.1 N hydrochloric acid (HCL) was added. The samples were then gently boiled for one minute to expel carbon dioxide (CO2). After cooling back to room temperature, the samples were titrated with 0.1 N sodium hydroxide (NaOH) to change in bromothymol blue indicator from yellow to blue. Two blanks also were tested. The following equation was used to calculate percent alkaline reserve. Two replicates of each material were tested, and the results were averaged.
T2 is the NaOH required for the blank. T1 is the NaOH required for the sample. DW is the dry weight of the sample in grams.
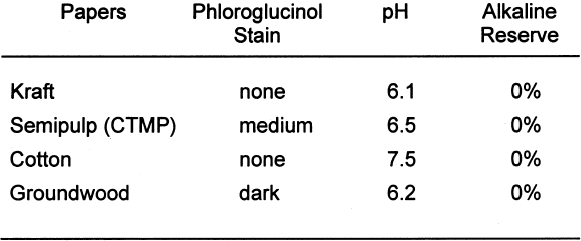
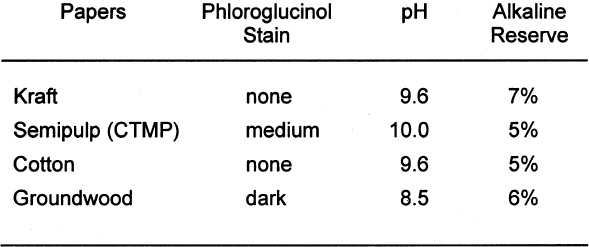
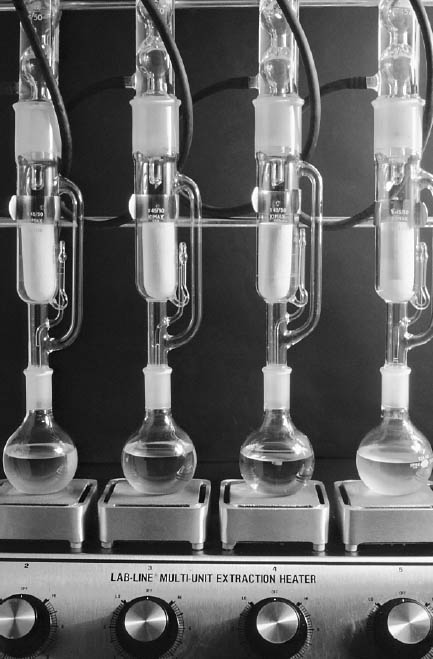
Tables 3 and 4 show the results of the analysis of the paper samples. The results of the paper analysis were almost all as expected. The one variable that seemed above normal was the pH of the buffered papers. The higher-than-expected pH values are probably due to the use of sodium carbonate in the papermaking process to control pH. The pH test measures the total pH of the paper, not merely the calcium carbonate content. Therefore, contributions to overall pH will be the sum of the pulp, the pH control, and the buffer. The nonbuffered papers used alum as a pH control. 2.2 EXTRACTED PAPERSThe role of wood extractives was studied by removing them from paper samples before performing tests for inertness toward photographs. For the samples in which the extractives were removed from the papers, the extraction method described in TAPPI T204 om-88 solvent extractives of wood and pulp (TAPPI 1988) was used. This method employs a Soxhlet apparatus (fig. 1). A variety of solvent or solvent mixtures are suggested. For this experiment the ethanol-toluene mixture was selected. This solvent mixture has had poorer reproducibility than the ethanol-benzene mixture when determining the exact concentrations of extractives. However, since the goal of this experiment was simply the removal of the extractives and not quantification of the extractives, it was felt that the ethanol-toluene mixture would be more appropriate, as it posed the smallest health risk.
Twelve-by-two-cm strips of each of the nonbuffered paper types were extracted for eight hours in the extractor. The extracted samples were then dried on blotter paper. 2.3 BOXESThe samples for the box test were constructed at IPI. Three sets of boxes were constructed. One was from gray chipboard purchased from the Rochester Institute of Technology bookstore. One was from the core of a three-ring binder, and another was from a buffered, purified wood-pulp board to be used as the control. The purified wood-pulp board was Exeter Conservation Board purchased from Light Impressions The lids on the boxes fitted tightly except for the one on the gray chipboard box, which, due to a construction error, had a small gap of 2 mm along one side. The boxes were lined on the bottom with polyester to prevent direct contact between the test detectors (see PAT below) and the bottom of the box. The size of the boxes was 3 � 16.5 � 16.5 cm. No interior paper liners were used in the boxes, unlike most boxes that are not solid construction throughout. The boxboards were tested with the phloroglucinol spot test to verify lignins content. A dark stain indicates the presence of lignins. Table 5 shows the results of the phloroglucinol spot test on the boxboards.
|
