SILVER-MIRRORING EDGE PATTERNS: DIFFUSION-REACTION MODELS FOR THE FORMATION OF SILVER MIRRORING ON SILVER GELATIN GLASS PLATESGIOVANNA DI PIETRO, & FRANK LIGTERINK
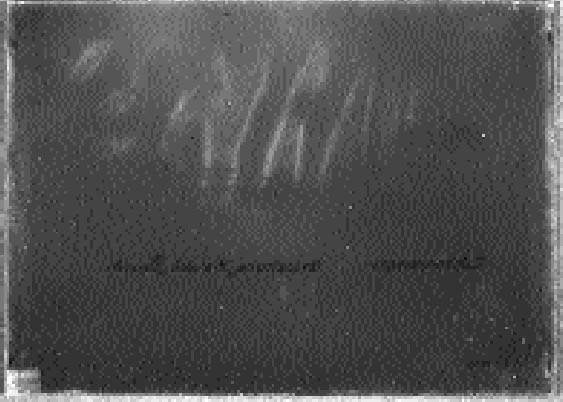
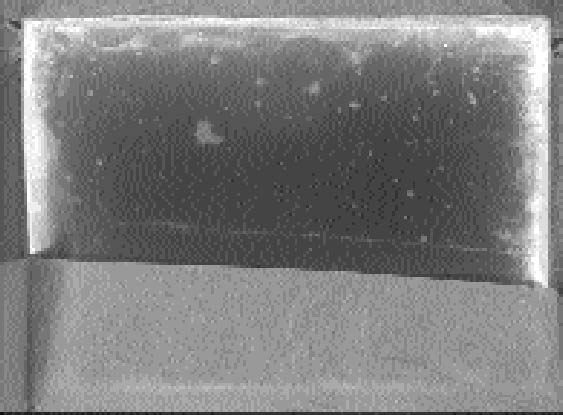
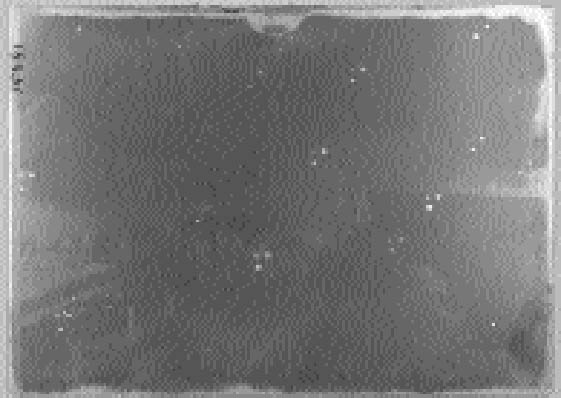
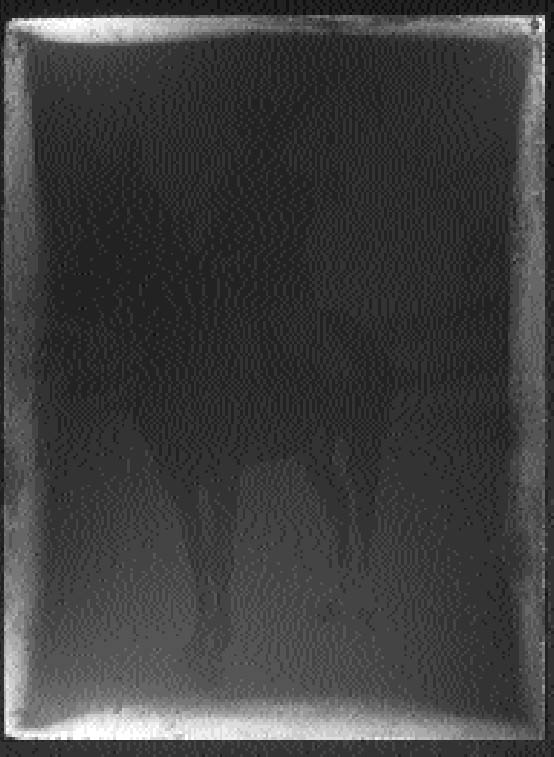
ABSTRACT—The silver mirroring that can be seen on many historical silver gelatin photographic glass plates is typically observed to be distributed in certain specific and distinct patterns. A study of these patterns gives information on the causes of silver mirroring and on the detailed nature of the degradation mechanism. This article presents two mathematical models based on the diffusion and reaction of gases that explain the formation of silver-mirroring edge patterns in the case of plates kept in stacks and in the case of plates freely exposed to environmental gases. The predictions are compared with the patterns found on historical plates and with the patterns artificially produced on new plates. TITRE—Formation du miroir d'argent sur les bords d'une image: un mod�le de diffusion et de r�action lors de la formation du miroir d'argent sur les n�gatifs sur plaques de verre. R�SUM�—Le miroir d'argent est une d�t�rioration qui peut �tre observ�e sur de nombreux n�gatifs historiques sur plaques de verre et qui est en g�n�ral distribu� de fa�on sp�cifique et distincte. Une �tude des motifs cr��s par le miroir d'argent fournit des informations sur ses causes et des d�tails sur la nature du m�canisme de d�gradation. Cet article pr�sente deux mod�les math�matiques qui sont bas�s sur la diffusion et la r�action des gaz et qui expliquent la formation du miroir d'argent sur les bords des plaques, quand celles-ci sont empil�es ou encore quand elles sont librement expos�es � l'air. Les motifs ainsi pr�dits sont compar�s aux mod�les observ�s sur les plaques de verre historiques et � ceux qui furent produits artificiellement sur des plaques modernes. TITULO—Patrones del espejo de plata en orillas: un modelo de reacci�n de difusion para explicar la formaci�n del espejo de plata en placas de plata/gelatina sobre vidrio. RESUMEN—El espejo de plata que se observa en muchas placas fotogr�ficas hist�ricas de plata/gelatina sobre vidrio, sigue patrones de distribuci�n claros y definidos. El estudio de estos patrones provee informaci�n sobre la causa del espejo de plata y la naturaleza precisa del mecanismo de degradaci�n. Este articulo propone dos modelos matem�ticos basados en la difusi�n y reacci�n de los gases, para explicar la formaci�n del patr�n de espejo de plata en las orillas de placas fotogr�ficas que han permanecido apiladas y de las que permanecen completamente expuestas a los gases ambientales. Las predicciones de estos modelos son comparadas con los patrones observados en placas hist�ricas y los patrones producidos artificialmente en placas nuevas. 1 INTRODUCTIONSilver mirroring is an iridescent, often bluish, metallic sheen that appears on the surface of silver-based photographic materials as a result of aging processes. Silver mirroring is generally confined to some local areas of the photograph, and it is present in various distinctive distribution patterns that seem to be connected to the environmental conditions in which the photograph is stored. Silver gelatin glass plates are particularly prone to silver mirroring. They were the most common photographic negatives during the first decades of the 20th century. They consist of glass plates covered by a gelatin emulsion layer containing silver halide crystals that turn to metallic silver after processing. In some cases, silver mirroring patterns on silver gelatin glass plates are related to the features of the enclosure. Patterns sometimes coincide with wrinkling patterns (fig. 1) or with folds and edges (fig. 2) of the glassine envelopes. In other cases, isolated spots occur that are possibly connected with particles contained in the paper envelope (fig. 3). However, on most historical plates the silver mirroring sheen is confined to the plate edges, thus forming an edge pattern. The extension of the pattern can be either reduced (fig. 4) or enhanced (fig. 5) at the plate corners. Silver-mirroring edge patterns have been found on both processed and nonprocessed glass negatives. The edge patterns observed on historical plates
Patterns do not arise by coincidence; they are due to specific physical and chemical mechanisms. The observation and investigation of silver-mirroring patterns thus yield information on the process of silver-mirroring formation and on the conditions under which the degradation has taken place. This article is confined to the most common pattern of silver mirroring, the edge pattern. For the moment, we believe that the development of a general theory to describe all the possible silver-mirroring patterns is still too big a step.
2 PRESENT KNOWLEDGE OF SILVER MIRRORINGSince the first accounts of silver mirroring on bromide negatives and prints, the origin of this type of degradation was proposed to be connected with the reaction of atmospheric gases such as hydrogen sulfide with silver compounds in the emulsion (British Journal of Photography 1901). Deeper investigations into the nature of the gases and into the mechanism leading to silver mirroring were carried out in the 1960s (Henn and Wiest 1963). These studies were spurred by the discovery of red spots on negative microfilms correlated to the presence of silver mirroring. Peroxides or atmospheric oxygen in combination with hydrogen sulfide were indicated as gases responsible for silver mirroring. Later, in the 1980s, Hendriks (1989) collected their results, together with the model proposed by research studies at Fuji Laboratories (Torigoe et al. 1984) and the evidence provided by transmission electron microscopy (TEM) images of mirrored emulsions taken in his laboratory, and proposed a three-step mechanism for the formation of silver mirroring:
Evidence for this model was provided by the experimental studies of Nielsen and Lavedrine (1993), who investigated with TEM cross sections of historical and artificially reproduced silver-mirrored emulsions. On a microscopic scale, silver mirroring consists of a layer of particles with dimensions on the order of a hundred nanometers (1 nm = 10-9 m) located at the top surface of the emulsion. The three-step model proposed by Hendriks fails to explain the detailed mechanism of ion migration and reduction at the emulsion surface and therefore does not provide the possibility of predicting the rate of silver-mirroring formation. Nevertheless, it is widely accepted in the community of photographic conservation, and we believe the model to be substantially correct. 3 THEORYHendriks's model is based on the presence of oxidant and reducing gases in the environment surrounding the photograph. We will therefore explore the possibility that the occurrence of the silver-mirroring edge pattern is related to the diffusion and reaction of environmental gases with the photograph. The silver-mirroring pattern will in general result from competition between reactions, consuming the gases at the emulsion surface, and diffusion in air, transporting the gases toward the plate surface. To compare model predictions concerning the shape and extent of silver-mirroring edge patterns with actually observed edge patterns, both processes have to be included in a single model. Modeling of the reaction between the plates and the gas in terms of a reaction-rate law is, in principle, Modeling of the gas diffusion process toward the plate is relatively straightforward. The gas diffusion to the plates is determined by the geometry of the plate in the space, which is the position and shape of the plate, by the diffusion coefficient in air for the specific type of gas, and by the presence of ventilation that gives rise to convection currents able to alter the simple gas diffusion. The full general equations describing this phenomenon of diffusion and reaction are complicated to solve. We will restrict our discussion to a few simple cases starting from simplifying assumptions in terms of both geometry and reaction-rate laws. We will discuss two different geometries under which a plate can be exposed to reactive gases: (1) plates kept in stacks and (2) plates freely exposed to the environment. 3.1 STACKED-PLATE EXPOSURELet us consider silver gelatin glass plates kept in a stack, as, for example, the glass plates contained in a traditional box. The gases will penetrate from the surrounding air to the space between the plates, where they will be consumed by the reaction with the silver in the emulsion layers. The silver-mirroring pattern will also, in this case, be determined by the rate of diffusion of the gas parallel to the plate surface and by the rate of reaction with the plates. The amount of gas diffusing parallel to the plates will be proportional to the distance between the plates: the higher the distance, the higher the amount of gas able to diffuse between the plates. If the reactivity is high, the gas will be consumed as soon as it penetrates between the plates, and the silver mirroring will be confined to the very edge of the plate. If, on the other hand, the reactivity is low, the diffusion term will prevail over the reaction term, and the silver mirroring will be spread all over the plate. The simplest mathematical model that can predict an edge pattern assumes that the glass plate surfaces are parallel to each other and that the amount of gas reacting with the plates is proportional to the gas concentration at the plate surface, the constant of proportionality being the reaction probability (see appendix 1 for details). The gas absorption rate Ψ (g cm-2 s-1) decreases exponentially with the distance x (cm) from the plate edge according to:
The extension δ (cm) of silver mirroring can be taken as the distance at which the initial value of Ψ has halved:
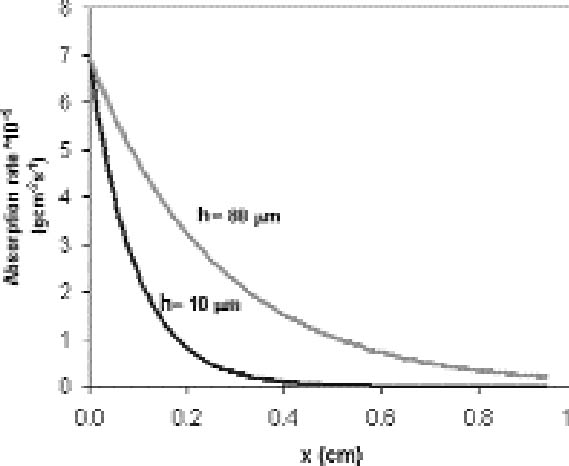
For a single plate we assume the reaction probability for the whole surface to be constant. From equation (3.2), it is then expected that the extension of silver mirroring is proportional to the square root of the distance between the plates. Figure 6 shows the decay of the silver mirroring for two different distances. The increase in the silver-mirroring extension with distance suggests that local variations of the silver-mirroring extension on a plate, like the ones in figure 4, could depend on local variations of the distance between two adjacent plates of the stack, taking place, for example, if the plates are buckled and not flat. Indeed, glass plates from before 1940 are not completely flat (Koob 2000). Although equations
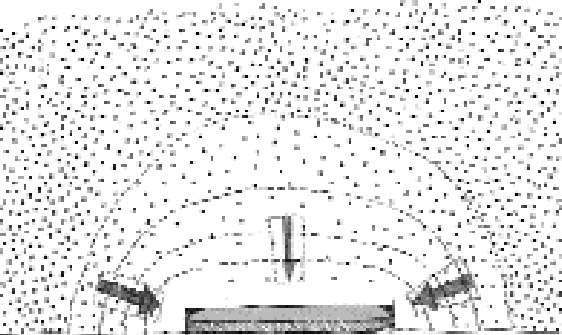
If, on the other hand, we fix the distance between the plates, the extension of silver mirroring will be inversely proportional to the square root of the reaction probability. High reaction probabilities will give rise to narrow and sharp silver mirroring patterns. It is important to stress that an exponential decrease in the silver-mirroring intensity with the distance from the edge is a direct consequence of the assumption that the amount of gas reacting is proportional to the gas concentration. Other types of reaction kinetics (e.g., reactions dependent on some power of the gas concentration or on the amount of silver available in the emulsion) would result in other than exponential distribution profiles of the silver-mirroring intensity. 3.2 SINGLE-PLATE EXPOSUREConsider a single silver gelatin glass plate freely exposed to a surrounding atmosphere containing a reactive gas. Because the gas reacts with the silver contained in the glass plate emulsion, the gas concentration in the proximity of the plate surface will be lower than the gas environmental concentration. The resulting difference in gas concentration between the environment and the space adjacent to the plate drives a constant flow of gas from the environment to the plate. The areas on the plate where the gas flow is higher will have a stronger silver mirroring. Two extreme cases can be considered. If the reactivity of the gas with the emulsion is low, there will be hardly any flow of gas from the environment to the plate. As a result, the gas concentration at the entire plate surface will be close to the environmental concentration, and the distribution of silver mirroring on the plate will be homogeneous. The same result will be achieved when the reactivity is high but external ventilation forces the gas concentration to be evenly distributed around the plate. If the reactivity is high and there is no ventilation, then the gas concentration near the plate will be practically zero, since every gas molecule reaching the plate will be immediately consumed by the reaction. In this case, we can qualitatively predict the distribution of the gas flow on the plate by looking at the shape of the planes of equal gas concentration, which are imaginary planes connecting points in the space having the same concentration value (fig. 7). The shape of the planes of equal concentration will resemble the plate in its proximity and, for symmetry reasons, will be spherical at a certain distance. As illustrated in figure 7, the gas concentration difference is
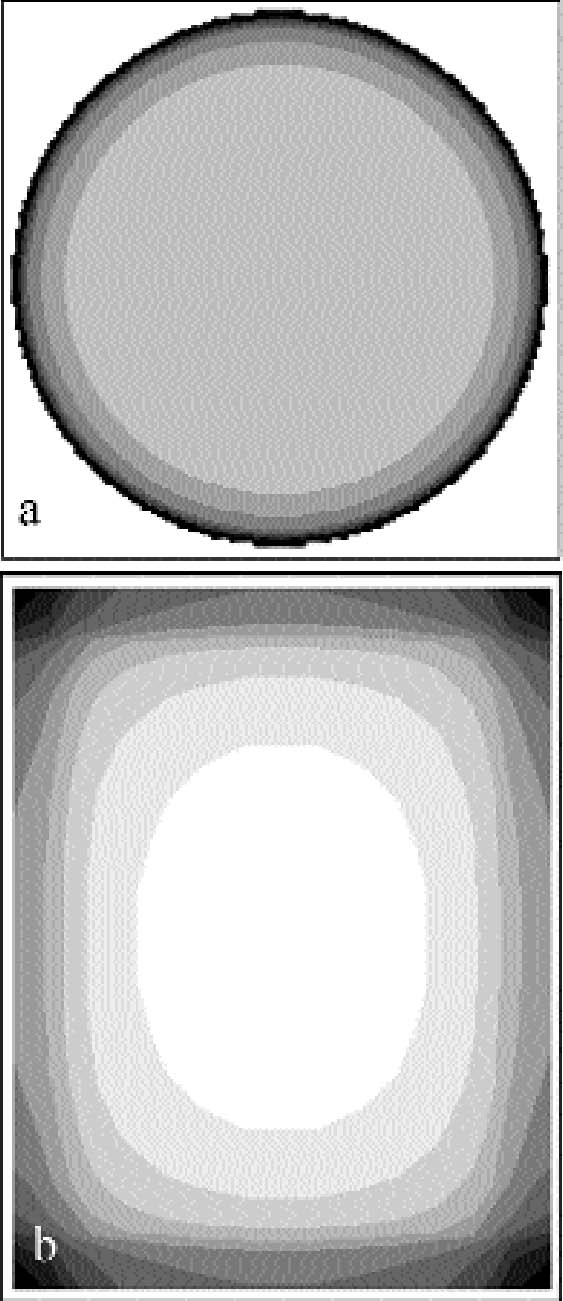
We have calculated with a mathematical model based on the assumptions of no ventilation and high reactivity (see appendix 2 for details) the amount of gas reacting per unit surface and time with the plate, the so-called gas absorption rate. In an initial approximation, the gas absorption rate can be assumed to be proportional to the visual intensity of silver mirroring. Figure 8a shows the calculated pattern for a hypothetical circular plate, while figure 8b shows the pattern for a rectangular plate. In the case of both the circular and the rectangular plate, the model predicts a higher absorption rate at the edges of the plate than at the center. 4 EXPERIMENTAL PARTTo verify the diffusion and reaction models presented above, two sets of experiments were performed. In the first set of experiments, a microscopic focusing technique was used to measure the curvatures of historical plates in order to determine local distances between adjacent plates. The correlation of local plate distance with local width of historically formed silver-mirroring edge patterns was checked against the theory. In a second set of experiments, the formation of silver mirroring was artificially reproduced on both single and stacked plates by exposure to a mixture of reactive gases in an incubation chamber. The resulting silver-mirroring edge patterns were compared against the theoretical predictions. 4.1 DETERMINATION OF PLATE DISTANCES AND EDGE PATTERN EXTENSION IN AN UNALTERED STACKThe present study is based on the survey of the Cueni Study Collection, a collection of about 150 glass plate negatives by the Swiss painter and amateur photographer Adolf Cueni, active in the Basel region in the years 1910–20. The plates, of no commercial value, were donated in the early 1990s by the Cueni family to the Laboratory of Scientific Photography of the University of Basel, in their original cardboard boxes, and have never been archived. The majority of
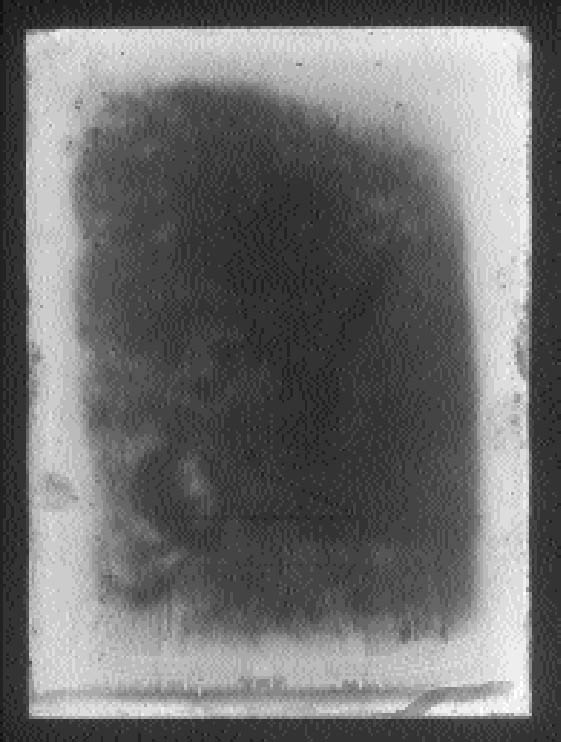
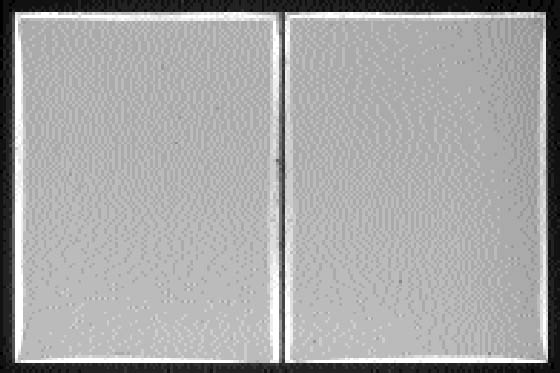
Obviously, it is not possible to check this relation unless the positions of the individual plates have not been altered since the development of the silver-mirroring edge pattern. Unfortunately, this is often not the case because historical plates have usually been manipulated a number of times in the course of their history. However, we were able to locate a number of plates showing silver mirroring that had never been moved. We found a number of nonprocessed and never-used glass plates still wrapped in the original black paper. Every wrapping paper contained the customary three pairs of glass plates. Within every pair, the emulsion sides were placed in contact. Not only did the plates show silver-mirroring degradation, but the pattern of silver mirroring on the two plates of a pair was exactly the same (fig. 9). To verify the expected relation between the local distance between two plates and the local width of the silver-mirroring edge pattern, it was decided to determine the variation in local distance between the plates. The distance between the two plates of a pair was measured by independently recording the shape of the two plates and recalculating the position in which they lay one on the other. The difference between the coordinates of the plates in this position gave the distance between the plates. Results of the interpolated distance measurements were then compared with photographs of the silver-mirroring edge patterns.
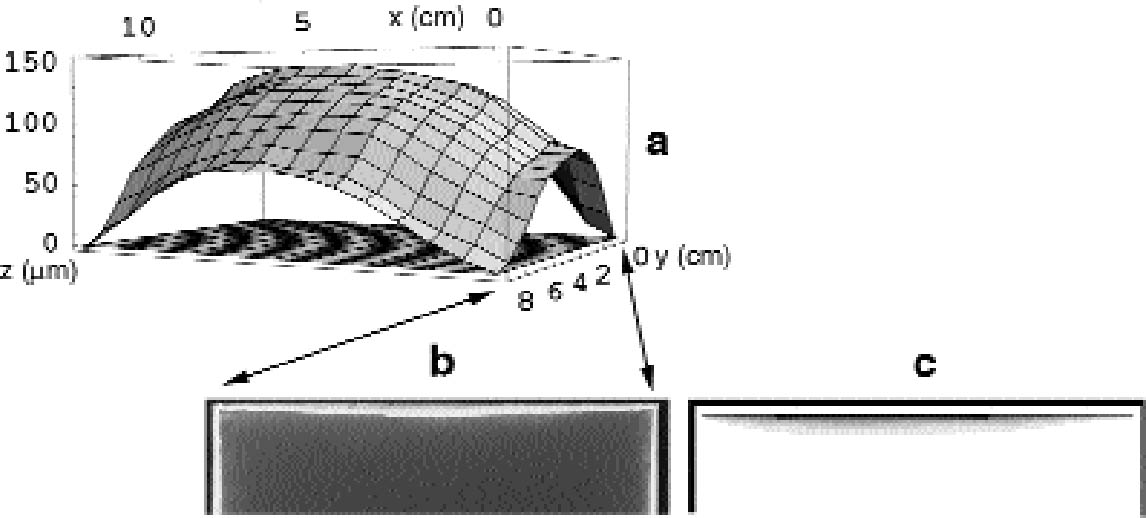
The shape of the plates was measured with a microscopic technique. The principle of the technique is based on the fact that the distance between the objective lens and the focal plane, the so-called focal distance, is a fixed characteristic of the objective lens. If the sample under observation is not flat, when the observation point is displaced on the sample the whole objective has to be moved up or down to get a focused image. By recording the coordinates (x, y) of the observation point and the coordinate z of the objective position, a map of the macroscopic shape of the sample is obtained. We used a confocal scanning laser microscope (CSLM) named Odyssey XL, produced by Noran Instruments. The CSLM is a system composed of an inverted light microscope (Axiovert 135 TV, Zeiss), a laser source (Omnichrome), a video-scanning module (Noran Instruments), and a host computer (Indy, Silicon Graphics). The images collected in the microscope are displayed, through the video-scanning module, directly on the computer monitor. The computer controls the microscope through a software interface (Intervision). We operated the microscope in the reflection mode with a laser wavelength of 568.2 nm with an objective (Pan Neofluar, Zeiss) providing a 40x magnification. The z position of the objective is automatically moved in fixed steps by the computer. The position of the observation point can be changed in the (x, y) plane by fixing the sample in the sample holder, which is connected to scales manually movable with micrometer screws. The standard sample holders do not allow for the fitting of a 9 � 12 cm plate. The plate was therefore positioned directly on the stage of the microscope and carefully attached with self-adhesive tape to the scales. We mapped the plate surface by recording the objective z coordinate on the points of a regular grid of 1 cm spacing, covering the whole plate. The error in determining the z position of the grid points is given by the distribution of the silver grains in the emulsion. It is on the order of 10 μm. The error in determining the (x, y) position is � 0.5 mm. Because of the limited availability of the confocal scanning laser microscope, with this technique we analyzed the shape of six plates. The shape of other silver gelatin glass plates was qualitatively evaluated with a simpler method. A highly flat metal blade was laid on the plate and illuminated from behind. The distribution of the light penetrating between the blade and the plate gave information on the plate shape. 4.2 INCUBATION CHAMBER EXPERIMENTSTo artificially create silver mirroring on new photographic plates, an incubation chamber was used to expose new processed silver gelatin glass negatives to the vapors of hydrogen peroxide (H2O2) and hydrogen sulfide (H2S) at 80% RH. This procedure was modified from the standard hydrogen peroxide test (ISO 2000). The incubation chamber is a 30 � 40 � 40 cm Plexiglas box covered with a lid fitted with a fan. The chamber hosts a sample holder of variable height and some trays for the evaporating solutions. Two trays are filled with a saturated solution of potassium chloride (KCl) to keep the RH at 80%. A third tray contains 10 ml of a 10% water solution of hydrogen peroxide. A fourth tray contains a 1:1 dilution in water of Kodak brown toner, a polysulfide toner releasing hydrogen sulfide. The glass negatives used are of the Agfa Avipan 100 type, of the dimensions 9 � 12 cm, and are uniformly exposed and processed in a standard way. The final plate density measured in T mode with a densitometer (X-Rite) is about 1.6. The plates are left in the incubation box for at least 24 hours at room temperature. From time to time, the hydrogen peroxide solution and the Kodak brown toner trays are recharged. The incubation chamber was used to perform three different exposure experiments. In the first experiment, a stack consisting of two plates was exposed in the chamber (fig. 10a). The horizontally orientated stack consisted of one historical glass plate whose shape had been previously measured with the microscopic method presented in section 4.1, on top of a flat, new, freshly processed Agfa Avipan 100 glass negative. In the second and third experiments, single plates were exposed in the chamber, without (fig. 10b) and with (fig. 10c) ventilation respectively. After exposure, the resulting silver-mirroring edge patterns
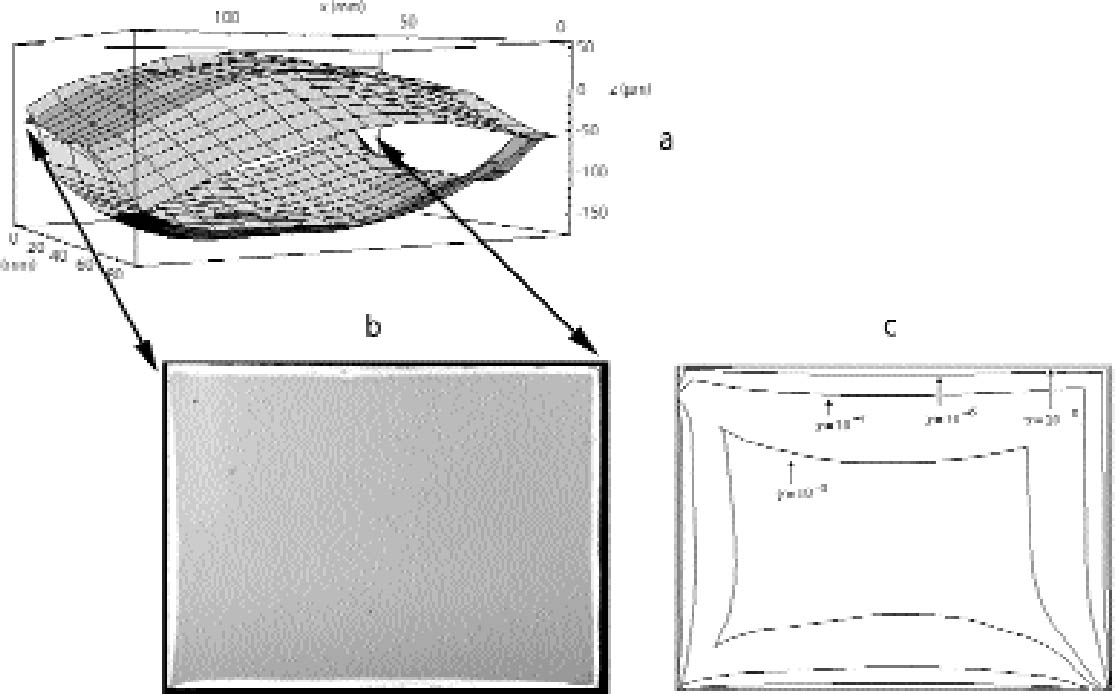
5 RESULTS5.1 PLATE DISTANCES AND EDGE PATTERNS IN AN UNALTERED STACKThe shapes of four individual plates originating from two pairs of nonprocessed plates from the Cueni Collection were measured with the microscopic focusing technique described in section 4.1. All these plates were found to be concave toward the emulsion. Typically only three out of four corners are in plane. As a result, two plates from a pair touch on only three corners. As a typical example, the distance variation between the pair of plates depicted in figure 9 is shown in figure 11a. The maximum distance between the two plates at the center of the plates is roughly 100 μm. Although in this study no attempt has been made to quantify the density profiles of the silver-mirroring edge patterns, the observed visual density can serve as a rough indication of the mass density distribution of mirroring particles. It should be borne in mind, however, that the visual intensity of silver mirroring is determined not only by the amount of mirroring but also by the size and distribution of particles making up the mirroring layer. The measured plate distances are in qualitative agreement with the corresponding silver-mirroring edge pattern shown in figure 11b. The silver mirroring extension decreases at the corners, where the plates are in contact, and increases when moving toward the center of the sides, where the plates are far apart. The silver-mirroring extension at the upper right corner does not follow this trend, consistent with the tilted position of the upper plate. The question was raised as to whether the buckling of the plates was related to the shrinking of the gelatin emulsion during aging. A preliminary examination of 137 plates showed that a majority, 106 plates (78%), were concave toward the emulsion side. The remaining 31 plates (22%) were convex toward
In figure 11c, the silver-mirroring extension is calculated from equation (3.2) for different reaction probabilities, using as distance between the plates that measured from figure 11a and as gas parameters the values for hydrogen peroxide (M = 34 g mol-1 and D=0.188 cm2 s-1). It can be seen that the reaction probability γ giving the silver-mirroring extension best matching with the pattern found on the plate is of the order of 10-6. 5.2 INCUBATION CHAMBER RESULTSThe microscopic focusing technique explained in section 4.1 was also employed to measure the shapes of the plates used in the stack exposure experiment depicted in figure 10a. The historical plate that was used had a concave shape, with concavity of approximately 150 μm in the direction of the emulsion. The new Agfa Avipan 100, however, was flat to a precision of 5 μm. The measured distance variation between the two plates is indicated in figure 12a. Figure 12b is a photograph of the edge pattern visible on the emulsion side of the Agfa Avipan 100 plate after exposure of the stack for a few days. The shape of the pattern is qualitatively consistent with the measured distance variation of the two plates. The extension of the silver mirroring decreases at the corners, where the two plates are in contact,
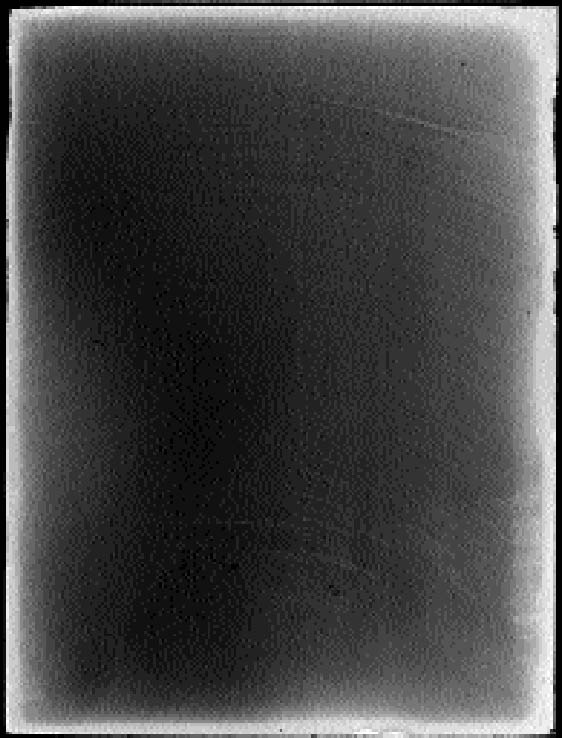
Figure 12c shows the pattern of silver mirroring calculated with equation (3.1) and using as gas parameters the values for hydrogen peroxide (M = 34 g mol-1 and D = 0.188 cm2 s-1) and as reaction probability γ = 5�10-6. Figures 13 and 14 show the patterns of silver mirroring obtained from the single plate exposure experiments. On the plate that was exposed without ventilation, the silver-mirroring intensity is clearly enhanced at the edges of the plate. On the plate that was exposed with ventilation, the silver-mirroring intensity is homogeneously distributed over the plate.
6 DISCUSSIONAll observations on edge pattern formation in stacks that were obtained in this study, from both naturally formed and artificially created silver mirroring, indicate that relative edge-width variations of silver mirroring on single plates are directly related to the local distance between two adjacent plates. This finding confirms the theory that the diffusion and subsequent reaction of gases cause the formation of silver mirroring.
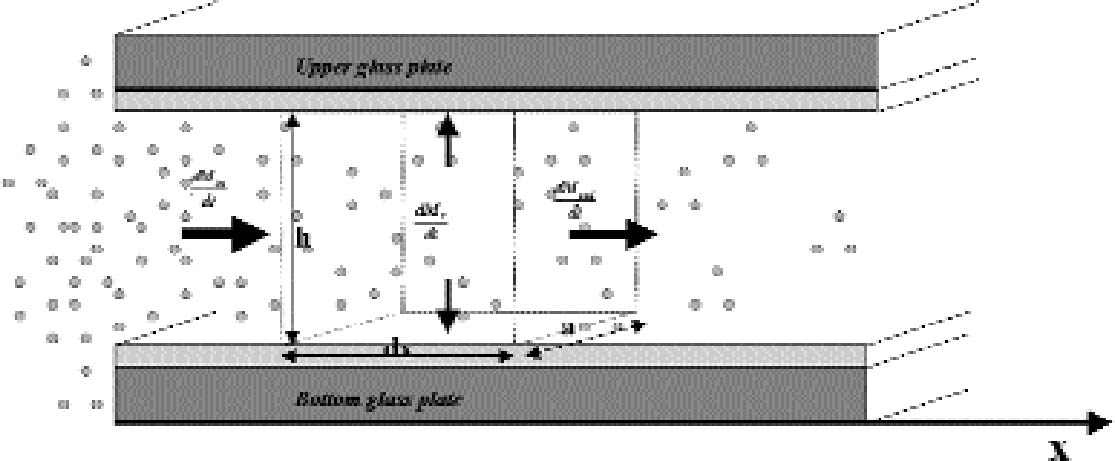
The pattern calculated from the theoretical gas absorption rate formula is in good agreement with the patterns found on the real plates. The silver-mirroring extension is underestimated at the plate corners, where diffusion takes place simultaneously from two sides, a more complicated situation than the one-dimensional model here presented. A comparison of edge patterns from different plates shows that both artificially created patterns and naturally formed patterns on nonprocessed plates are narrower, sharper, and more intense than the naturally formed patterns found on processed plates. This difference can be explained as a result of different reaction speeds. In the case of the artificially produced patterns, the reactivity is comparatively high, owing to the presence of hydrogen peroxide, a With the exception of the naturally formed silver mirroring on processed plates (figs. 4 and 5), the silver-mirroring edge patterns on all other plates (figs. 9 and 12) show a relatively even distribution of silver mirroring with a remarkably sharp boundary. Although these visual observations can serve only as a rough indication for the mass distribution of silver mirroring, the actual patterns observed indicate the presence of nonexponential mass distribution profiles. It can be concluded that for these plates the amount of gas reacting is not proportional to the gas concentration. The simple exponential model that was discussed in the theory section cannot describe the phenomenon of a sharp boundary. The results for the single plates that were freely exposed in the incubation chamber indicate that in the absence of ventilation, an edge pattern is formed. When the air around a plate is agitated, no such edge pattern is formed. These results show that a simple diffusion-and-reaction mechanism can give rise to edge patterns on photographs freely exposed to the surrounding atmosphere. As suggested by Nishimura (2000), the same mechanism could play a role in the edge yellowing of photographs freely exposed to the environment. 7 CONCLUSIONSThe formation of silver-mirroring edge patterns on both single-glass and stacked-glass negatives can be understood as being the result of a gas diffusion and reaction mechanism. Incubation chamber experiments show that, in the absence of ventilation, edge patterns can also arise on single-glass negatives. For stacked-glass negatives, local variations of the inward extension of silver mirroring are correlated to the local distance between the plates. Visual characteristics of edge profiles indicate that reaction mechanisms involved do not obey simple first order reaction kinetics. APPENDIXAPPENDIX 1In this appendix an equation is derived to describe the diffusion of a gas between two reactive surfaces. The law of mass conservation states that, for a steady state concentration profile, the difference between the amount of gas leaving and entering a small air volume of dimensions dx � h � a (cm3) (fig. 15) per unit time [(dmout/dt) – (dmin/dt)] (g s-1) is equal to the amount of gas removed from the air volume because of reaction with the emulsion-dmr/dt (g s-1):
The left-hand part of equation (A1.1) is found by considering that the mass of gas entering through an area h � a (cm2) is the gas flow times the area and by applying the first law of diffusion, Fick's law (Crank 1975):
The right part of equation (A1.1) is found with the reaction collision theory (Volpe and Peterson 1989; Atkins 1990), that is, by calculating the number of collisions between the gas and the top and bottom emulsion surfaces per unit time and assuming that only a fraction γ of them will give rise to a reaction:
R is the gas constant (R = 8.313�107 g cm2 s-2K-1 mol-1), T (K) the absolute temperature, and M (g mol-1) the gas molecular weight. By substituting equations (A1.3) and (A1.2) in (A1.1) and simplifying, we obtain the final equation describing the gas concentration between the plates at equilibrium:
The problem (A1.4) has a simple exponential solution:
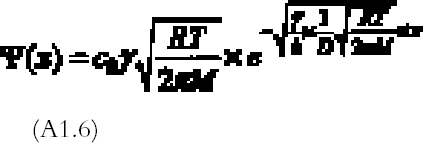
The amount of mirroring on the plate will be proportional to the amount of gas reacting with the plate per unit surface and time, the so-called gas absorption rate Ψ (g cm-2 s-1). The gas absorption rate is found by substituting the concentration profile equation (A1.5) in equation (A1.3) and dividing by the total surface area of bottom and top emulsion surfaces (2a � dx):
APPENDIX 2With the hypothesis of high reactivity and no ventilation, the steady-state diffusion equation (Crank 1975) for the gas concentration c (g cm-3) surrounding a freely exposed plate is:
The amount of gas reacting per unit surface and unit time with the plate, the so-called gas absorption rate Ψ (g cm-2 s-1), can be calculated from the concentration profile solution of (A2.1)–(A2.2) with Fick's law (Crank 1975) being equal to the gas flow J (g cm-2 s-1) calculated at the plate surface:
Problems (A2.1)–(A2.2) can be solved analytically in the case of a plate with circular shape (Landau and Lifshitz 1960, 27). The problem solved in the reference is finding the electrostatic potential Φ generated by a charged disk of radius a. This problem is identical to the gas The gas absorption rate is in this case given by:
Figure 8a shows the contour plot of the absorption rate (A2.4). In the more realistic case of a rectangular plate, problem (A2.1)–(A2.2) cannot be solved analytically. We solved the problem with the finite element analysis numerical technique. The finite element method consists of dividing the space into small areas and looking for approximate solutions in each of them. The solutions are then combined to get an approximate solution on the whole space. As this method requires a large number of calculations, it is normally performed with the aid of computer programs. We used a freeware program available on the Web called Tochnog (www.tochnog.com). The solution for a 9 � 12 cm plate was found within a three-dimensional square box with dimensions of 50 � 50 � 50 cm. The box was divided into regular cells by drawing a grid of 1.5 cm spacing. The plate resulted as being covered by 77 nodes. The program calculates the value of the gas concentration and of the gas flow at each node. The values of the gas flow at the nodes on the plate give the gas absorption rate. Figure 8b shows the contour plot of the absorption rate for the rectangular plate. APPENDIX 3In order to evaluate the buckling of a glass plate under the action of a shrinking layer of gelatin, we will analyze a simplified model. Let us consider a glass bar of length L (cm) equal to the longest side of the glass plate and of rectangular cross section of dimensions dg � δ (cm2), where dg (cm) is the thickness of the glass plate and δ is an arbitrary length with δ<<L. A gelatin layer of cross section of dimensions de � δ (cm2), where de (cm) is the thickness of the emulsion, covers the bar. The gelatin layer is taken as being attached to the glass only at the two extreme ends of the bar. During shrinking, the gelatin exerts a force directed toward the center of the bar and applied at its two ends. This force is given by the stress ς (g cm-1 s-2) applied by the gelatin times the gelatin cross section:
The theory of the buckling of beams (Feynman et al. 1964) allows for the prediction of the minimum force applied at the two ends of the bar necessary to deform it, the so-called Euler force:
Substituting (A3.3) in (A3.2) and equating (A3.1) and (A3.2), we get an expression for the minimum stress able to deform the bar:
Taking L as the largest side of the glass plate, L = 12 cm, dg = 0.13 cm, de = 5 � 10-3 cm, and Y = 3 � 1011 to 6 � 1011 g cm-1 s-2, depending on the glass composition (Uhlmann 1980), we get ς = 7.5 � 108to 1.5 � 109 g cm-1 s-2. This value can be compared The minimum stress necessary to buckle the glass bar is 20 to 50 times greater than the stress actually exerted by a layer of drying gelatin. No data are available in the literature for the stress developed by a gelatin layer during aging. ACKNOWLEDGEMENTSThe authors would like to thank U. B. Kejser for providing many references on silver mirroring, S. Dobrusskin for providing the plates shown in figures 1 and 3, and J. S. Johnsen for providing the recipe modified from the standard hydrogen peroxide test. REFERENCESAtkins, P. W.1990. Physical chemistry. 4th ed.Oxford: Oxford University Press. British Journal of Photography. 1901. The permanency of toned bromide prints. British Journal of Photography18 (January):39–40. Crank, J.1975. The mathematics of diffusion. Oxford: Oxford University Press. Feynman, R. P., R. B.Leighton, and M.Sands. 1964. The Feynman lectures on physics. Vol. 2. Reading, Mass.: Addison-Wesley. Chap. 38. Hendriks, K. B.1989. The stability and preservation of recorded images. In Imaging Processes and Materials, ed. J.Sturge et al. New York: Van Nostrand Reinhold. 637–84. Henn, R. W., and D. G.Wiest. 1963. Microscopic spots in processed microfilms: Their nature and prevention. Photographic Science and Engineering7(5):253–61. ISO. 2000. Imaging materials: Methods for the evaluation of the effectiveness of chemical conversion of silver images against oxidation, ISO 18915. Geneva: International Organization for Standardization. Koob, S.2000. Personal communication. Corning Museum of Glass, One Museum Way, Corning, N.Y. 14830. Landau, L. D., and E. M.Lifshitz. 1960. Electrodynamics of continuous media. Oxford: Pergamon Press. Mecklenburg, M. F., M.McCormick-Goodhart, and C. S.Tumosa. 1994. Investigation into the deterioration of paintings and photographs using computerized modeling of stress development. Journal of the American Institute for Conservation33(2):153–70. Nielsen, U. B., and B.Lavedrine. 1993. Etude du miroir d'argent sur les photographies. In Les documents graphiques et photographiques. Paris: Archives nationales. 131–43. Nishimura, D.. 2000. Personal communication. Image Permanence Institute, Rochester Institute of Technology, Rochester, N.Y. Torigoe, M. K. Ohmura, S.Yagami, and H.Iwano. 1984. A challenge in preservation of black and white photographic images. Scientific Publications of the Fuji Photo Film Co., Ltd.29: 31–36. Uhlmann, D. R., ed.1980. Glass: Science and technology. New York: Academic Press. Volpe, L., and P. J.Peterson. 1989. The atmospheric sulfidation of silver in a tabular corrosion reactor. Corrosion Science29(10):1179–96. SOURCES OF MATERIALSGlass plate negatives: Agfa APX Avipan 100 (90�120�1.5 mm)Agfa-Gevaert AG Stettbachstrasse 7 CH-8600 D�bendorf Switzerland Fluka Chemie AG Postfach 260 CH-9471 Buchs SGI Switzerland AUTHOR INFORMATIONGIOVANNA DI PIETRO studied physics at the University of Milan, where in 1994 she received her master's degree with a specialization in experimental physics. Since 1996 she has collaborated with the Instituut Collectie Nederland as a conservation scientist. In June 2002 she received her Ph.D. in chemistry at the University of Basel's Laboratory of Scientific Photography with a thesis on silver mirroring on silver gelatin glass plates. Address: Laboratory of Scientific Photography, University of Basel, Klingelbergstrasse 80, CH-4056, Switzerland. FRANK LIGTERINK, a paper conservator, graduated in 1989 from the Opleiding Restauratoren, Amsterdam. From 1989 to 1995 he studied at the Vrije Universiteit, Amsterdam, where in 1995 he received his master's degree in physics with a specialization in theoretical physics. In 1996 he received his qualification as a physics teacher. Currently he is working at the Instituut Collectie Nederland as a conservation scientist. Address: Instituut Collectie Nederland, Gabriel Metsustraat 8, 1071 EA Amsterdam, The Netherlands.
 Section Index Section Index |
