THE SWELLING OF ARTISTS' PAINTS IN ORGANIC SOLVENTS. PART 1, A SIMPLE METHOD FOR MEASURING THE IN-PLANE SWELLING OF UNSUPPORTED PAINT FILMSALAN PHENIX
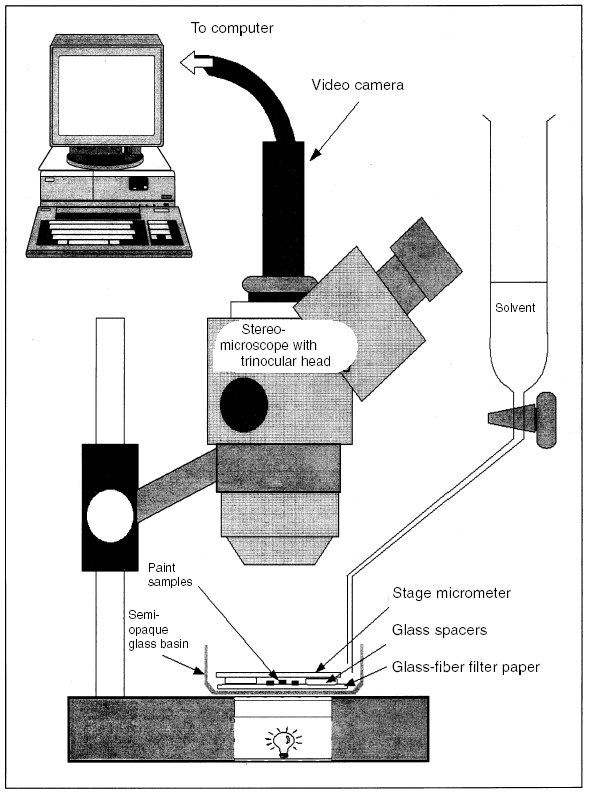
2 EXPERIMENTAL METHODThe method for measuring paint swelling proposed here is a relatively low sensitivity technique suitable for use on unsupported paint films. Lateral, in-plane swelling is determined by a simple method that is loosely based on that of Brunt (1964) and Eissler and Princen (1968, 1970) but with significant improvement to the measurement aspect through the use of computer-based image analysis. The general experimental setup is illustrated in figure 1. Images of the paint samples during immersion in solvent are captured using a video camera fitted without lenses, via a trinocular viewing head, to a low-power stereo zoom microscope (objective range 1–4x). The video camera is linked directly to a computer: images are captured and digitized by an internal image grabber (Neotech). Two video cameras were used for the results reported here: a Moritex Micro-Scopeman MS-500HR-RGB and a JVC TK-C1380E. Both have 752 x 582 pixel array detectors. The computer used was an Apple Power Macintosh G3 computer (233 MHz, 4 GB disk, 128 MB RAM, 6 MB SGRAM, 20 in. Sony Trinitron monitor). The digitized images are in monochrome, 8-bit gray scale, i.e., a maximum palette of 256 levels of gray. All raw and processed images are archived onto a rewritable disc.
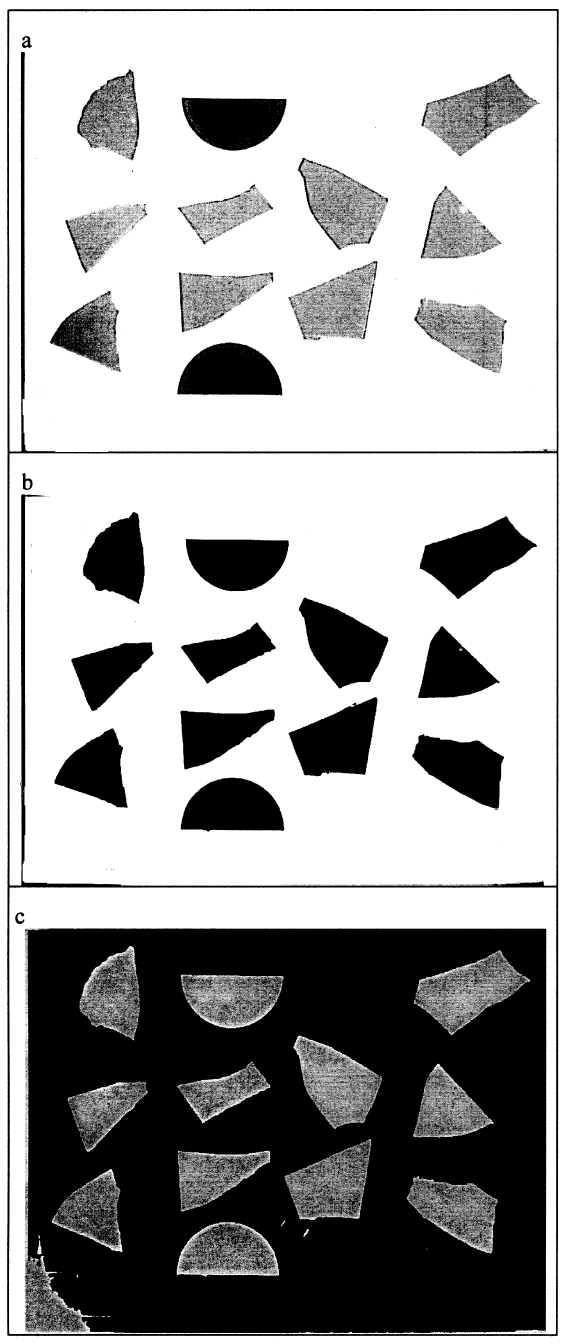
The paint fragments for testing are cut from larger samples of known thickness and are placed on a disc of glass-fiber filter paper. In turn, this disc is placed in a semi-opaque glass basin in which the swelling test is conducted. The basin is viewed through the microscope in transmitted light using the microscope's internal tungsten-halogen light source, the semi-opaque basin and filter paper serving as diffusing screens so that the paint fragments are seen as silhouettes against a uniform, bright background. To limit heat gain from the tungsten-halogen light To conduct a swelling experiment, the selected solvent is quickly run into the basin from a dropping funnel. Care must be taken not to displace the paint fragments from the field of view; this step can be difficult with solvents having high surface tension, such as aqueous solutions. The first image, representing t = 0, is captured the moment the paint fragments become wetted with solvent in the meniscus between the basin and the stage micrometer. The t = 0 image defines the initial paint fragment dimensions from which changes in area are determined. As they swell in the solvent, images of the samples are then taken at regular intervals over a time period ranging from 40 to 60 minutes for the faster-diffusing solvents like acetone, to 180 minutes or more for slower diffusers, or even for periods as long as 24 hours for aqueous liquids. Focus and magnification are not adjusted during an experiment in order to ensure internal consistency of images, and the scale of the cover slide is included in the field of the images for calibration purposes. All images of the samples immersed in solvent are captured ostensibly under constant conditions of illumination and viewing. As mentioned previously, the microscope lamp is illuminated only when necessary to capture an image of the samples in order to prevent heating the solvent and paint samples. During the course of the swelling experiment, the basin is covered to restrict evaporation and evaporative cooling of the samples. The initial volume of solvent in which the samples are immersed is generally on the order of 10 ml. No additional solvent is added to the basin during the course of the swelling experiment for reasons that are explained below. The stock of test solvent is always conditioned to the ambient room temperature to limit any thermal effects. Clearly, the absolute resolution of area measurement will be dependent on the degree of magnification employed for a given experiment. There are, however, advantages to using lower magnifications, for lower magnification provides a broader field of view through the microscope and, consequently, the possibility of including more sample fragments in a single swelling experiment. The choice of magnification is, therefore, something of a compromise of dimensional resolution and quantity of data/statistical validity. In practice, differential sample response is by far the strongest cause of variability in measured results. For the majority of experiments conducted so far, magnifications of 1.5–2.0x are generally employed, which allow 8–10 paint fragments ca. 2–5 mm2 to be measured for swelling simultaneously and with reasonable accuracy. In terms of absolute resolution, at an objective magnification of 2.0x, one pixel corresponds to an area on the order of 0.000124 mm2. Higher magnifications are, of course, perfectly possible, but these give reduced fields of view and so constrain the size or number of samples that may be viewed simultaneously. Where possible, following the approach of Eissler and Princen (1968, 1970), the small paint fragments under test are triangular in shape. However, the more brittle films often fracture into shapes other than triangular, but paint fragment shape has been found to exert little influence on the area-swelling measurements. All paint samples of a given type are substantially the same thickness. Thickness ranges of the paint films examined are The raw data, then, from a swelling experiment are a set of images of paint fragments at different times and degrees of swelling. A typical raw image is shown in figure 2a. For strong-swelling solvents, the dimensional changes that samples undergo during the course of swelling are clearly perceptible on a purely visual basis. Typically, 10–15 images are collected per experiment, with images captured more frequently in the early stages when the rate of swelling is greatest. All the sample images thus captured are image-processed as a group: the same operations are applied to all images in an experiment set. The first stage in the electronic processing is adjustment of brightness and contrast to render the paint fragments as distinct dark particles against a white background, which is done in Adobe Photoshop 5.0 (see fig. 2b). The same brightness and contrast levels are applied to all the images of immersed samples. Sharpening filters may also be applied to the digitized images if thought to improve image quality. Again, the same filter is applied to all images in a set to ensure internal consistency.
Quantitative data on the size of the individual paint fragments cannot be extracted directly using Adobe Photoshop, and to measure the changes in paint fragment dimensions the images are exported to Graftek Optilab 2.6.1. This software package has been used previously to measure changes in weave geometry parameters of artist's canvases as a function of RH (Bilson 1996). The images of paint fragments immersed in solvent are first calibrated for dimension, as a group or individually, against the stage micrometer. They are then thresholded to render the paint fragments as discrete particles against a dark background, as in figure 2c. The Optilab software has functions for detecting discrete particles and for defining their dimensions in terms of more than 20 different parameters. At the resolutions operating in the present method, sample perimeter as an indicator of swelling—which was determined microscopically in the method of Eissler and Princen (1968, 1970)— was found to involve a high degree of variability due to differential pixelation in the image capture and processing operations. Particle area has been found to be a far more reliable descriptor of paint fragment swelling. The absolute values of particle area measured at each time interval are converted to % change in area by simple calculation against the t = 0 values
|