A PROPOSAL TO REDUCE THE EXPOSURE TO LIGHT OF MUSEUM OBJECTS WITHOUT REDUCING ILLUMINANCE OR THE LEVEL OF VISUAL SATISFACTION OF MUSEUM VISITORSCHRISTOPHER CUTTLE
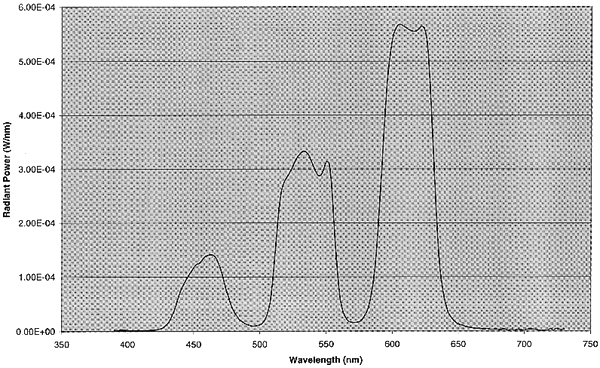
2 2. METHODS AND MATERIALSThe experiment consisted of identical reproductions of artwork presented in two adjacent simulated art gallery settings, one the test situation and the other the comparison situation. Subjects adjusted the illuminance in the test situation to match the appearance of the comparison situation. The comparison situation was always illuminated to 50 lux by an MR lamp, and the test situation was illuminated alternately by an MR lamp and an experimental three-band light source. The settings were recorded and compared to see whether there were differences in the illuminances that subjects selected to achieve similar appearances. Differences of irradiance were calculated from the recorded illuminances. Also, subjects were questioned on any differences of appearance they noticed after making each setting. 2.1 2.1 THE three-band LIGHT SOURCEFigure 1 shows the spectral power distribution for an MR16 20/12 BAB/FL/40 lamp operating on slightly reduced voltage to provide 50 lux in the experimental situation with a CCT of 2850 K. Note the characteristic smooth, continuous curve climbing toward the long-wavelength end of the spectrum. The decline above 700 nm is due to the dichroic reflector, which is partially transparent to IR and extreme long-wavelength visible radiation. All spectral power distribution measurements were made with an Oriel Instruments model 7740 spectroradiometer.
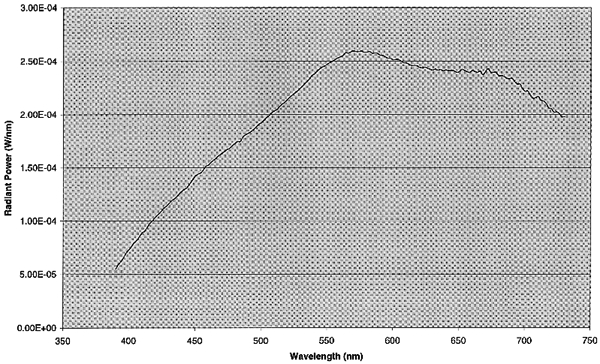
While a practical three-band light source for museum use will consist of a single lamp, with or without a filter, for the experimental situation the three bands were provided by separate lamps, each with a band-pass filter. The band center wavelengths identified by Thornton are at 80 nm intervals, and three types of 50 mm diameter, 40 nm band pass filters were obtained. The 450 nm filter was available as a stock item, but the 530 nm and 610 nm filters were custom items. The filters were mounted in compact industrial luminaire housings fitted with 50 watt MR lamps. Because of the low radiant power from these lamps at short visible wavelengths, it was necessary to use two 450 nm sources. Figure 2 shows the spectral power distribution for these lamp and filter combinations with their outputs balanced to match the CCT of the source shown in figure 1. The difference in the SPD curves is strikingly obvious: not only are the end parts of the visible spectrum missing, but also there are two deep notches in the curve. Data for the MR and the three-band sources are given in table 1, from which it can be seen that the radiant luminous efficacy for the three-band source is 70% higher than that for the MR lamp. This result means that at equal illuminances (lux), the three-band source will produce 41% less irradiance (W/m2).
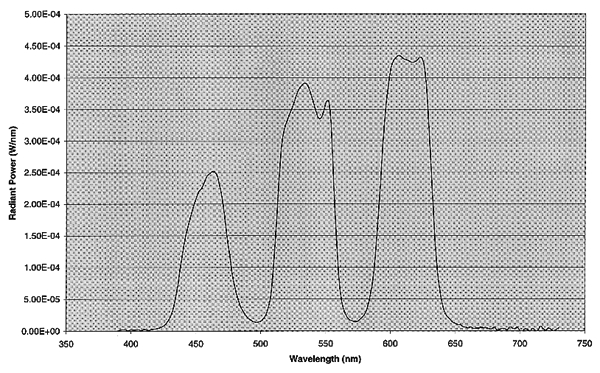
The process of adjusting the balance of the three wave bands of the experimental source was tedious and time consuming. However, the experimental procedure required the three-band source to be dimmable, which created a problem: how to vary the output of the source while maintaining the balance of the wave bands. The problem was solved by a feedback device that was developed specially for this experiment. Each lamp housing was fitted with a light sensor directed toward the lamp. The sensors were connected to the feedback device, a custom electronic circuit that continually monitored the outputs of the lamps and maintained them in constant ratios. The control operated by the subject changed the output of the mid-wave-band lamp, and the feedback device made instantaneous proportional changes to the lamp outputs for the other two wave bands. By operating a switch outside the test room, the experimenter selected whether the subject's control operated the three-band source or the MR lamp, so that the subject was given no obvious indication of which type of light source was in use. The first phase of the experiment was completed using low CCT (approximately 2850 K) sources. For the second phase, the regular MR lamps were replaced with 12 volt, 50 watt “SoLux” MR lamps, which were dimmed to provide 50 lux at approximately 4200 K. Figure 3 shows the spectral power distribution and the loss of long-wavelength power to achieve the higher CCT is apparent. The three-band source was adjusted to match this CCT, and the spectral power distribution is shown in figure 4. Data for these sources are also shown in table 1, and for this higher color temperature the radiant luminous efficacy for the three-band source is 46% higher than for the MR lamp. The main reason this difference is less than for the low color temperature case is that the radiant luminous efficacy of the MR lamp is higher. However, this property does not result because it is a more efficient lamp, but because less radiant power is emitted at the long-wavelength end of the visible spectrum, where the luminous efficiency is very low.
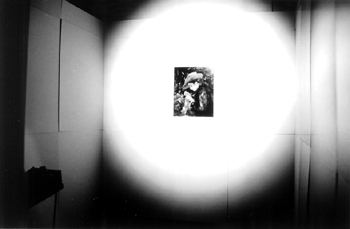
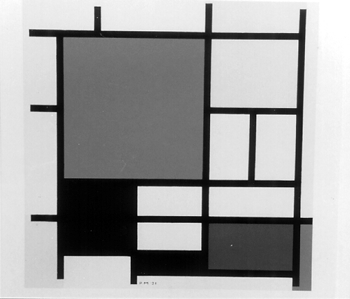
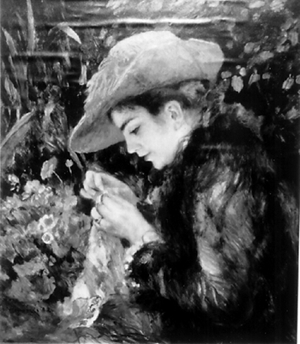
2.2 2.2 EXPERIMENTAL DESIGNThe experimental design called for a pair of identical “art gallery” settings to be viewed sequentially. An important aspect of the museum viewing experience is that the viewer visually adapts to the ambient illumination, and this adaptation would not be achieved by side-by-side viewing or any other form of simultaneous presentation. Two adjacent partitioned offices measuring 8 ft. 6 in. by 6 ft. 9 in. by 7 ft. high were lined with white Fome-core, and three pairs of identical prints of artworks were presented in these simulated “art gallery” settings. Figure 5 shows one of the settings. The artworks selected were:
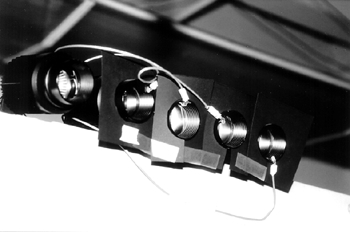
The comparison situation was lit by an MR lamp that was preset by the experimenter to an illuminance of 50 lux. The test situation was lit alternately by an MR lamp identical to the one in the comparison situation, or by the three-band source adjusted to have CCT and chromaticity matched to the comparison source. The arrangement of the light sources in the test room, including the sensors connected to the feedback device, is shown in figure 9.
The subjects were each taken to the comparison situation, where one of the artworks was on display at the preset illuminance. They were instructed to suppose that this was an art gallery and that they had come to see this picture. Then they were taken to the test situation, where the identical artwork was on display, and they were told to adjust the control “to match the appearance of this situation as closely as possible to the appearance of the previous situation.” Subjects could return to the comparison situation as often as they wished, but could not view the two situations simultaneously. When a setting had been made, the experimenter recorded the control reading and asked if the subject could see any differences between the two situations, using five categories of difference:
A 7-point scale was used to describe the magnitude of the difference of appearance of the test situation relative to the comparison situation: +3 = much more; +2 = more; +1 = slightly more; 0 = no difference; −1 = slightly less; −2 = less; −3 = much less. For each phase of the experiment, subjects made six settings, one for each of the two sources illuminating each of the three artworks. The order of presentations was randomized for each subject. The light source CCT was approximately 2850 K for the first phase, and subjects returned to repeat the procedure for the second phase, for which the CCT was approximately 4200 K. Light source data are given in table 1. |