FURTHER STUDIES ON TRANSPARENT GLAZE FADING: CHEMICAL AND APPEARANCE KINETICSPAUL M. WHITMORE, & CATHERINE BAILE
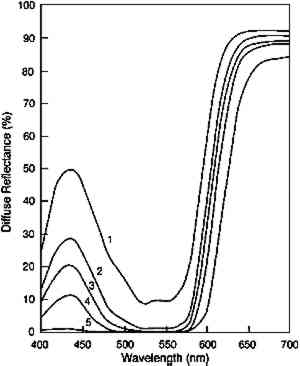
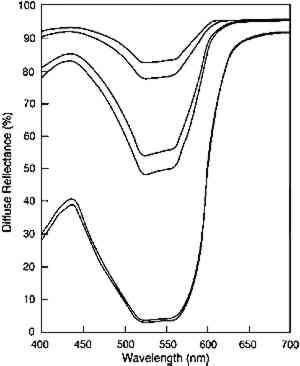
ABSTRACT—The light fading of transparent glazes is described from two perspectives: first in terms of the colorant loss from photochemical reaction, then in terms of the color changes that result from that colorant loss. The authors postulate that if the rate of colorant loss depends only on the amount of light absorbed at the photochemically active wavelengths, then the results of light exposure of dark and pale glazes should be very different. The loss of colorant in highly absorbing glazes should be constant with exposure, but only minor spectral changes that cause slight hue and chroma changes are produced. In paler glazes that absorb less light, colorant loss from light exposure should be slower than for dark glazes, and it should also become progressively slower as colorant is lost. Despite this slower colorant loss in pale glazes, large spectral changes result, giving rise to the large chroma losses and value increases that are the changes normally associated with fading paints. The general trends predicted by this simple model were observed in fading experiments of Pigment Red 66 glazes. Although some discrepancies from the idealized fading behavior were observed, these trends are suggested as a starting point for identifying glaze applications that may be at high risk of light-induced damage and may thus warrant special care or condition monitoring. TITRE—Nouvelles Recherches sur la D�coloration des Glacis Transparents: Cin�tique de la Composition Chimique et de l'Aspect Ext�rieur. R�SUM�—La d�coloration par la lumi�re des glacis transparents s'�tudie sur deux plans diff�rents: celui de la perte de colorant r�sultant d'une r�action photochimique, et celui des modifications de la coloration qui s'ensuivent. Pour les auteurs de cet article, si le taux de d�coloration ne d�pendait que de la quantit� de lumi�re absorb�e aux longueurs d'onde photochimiquement actives, l'exposition � la lumi�re aurait des effets tr�s diff�rents sur les glacis fonc�s et sur les glacis clairs. Un glacis hautement absorbant devrait subir une perte en colorant constante; ou on ne constate dans ce cas que des variations spectrales mineures, n'entra�nant que de l�g�res modifications de teinte et de saturation. En ce qui concerne les glacis de couleur claire, la d�coloration due � l'exposition � la lumi�re devrait �tre plus lente que sur les glacis plus fonce�s, et devrait, en outre, ralentir progressivement, au fur et � mesure de la perte en colorant. Pourtant, on observe d'importantes modifications spectrales, qui sont � l'origine de considerables pertes de teinte et eclaircissements typiques de la d�coloration des peintures. Les tendances ressortant de ce mod�le simple ont �t� confirm�es dan l'ensemble par des exp�riences de d�coloration portant sur des glacis effectu�s avec le pigment Rouge 66. Si l'exp�rimentation r�v�le quelques diff�rences par rapport au comportement th�orique des glacis, ses conclusions g�nerales sont � m�me de constituer un point de d�part pour l'identification des glacis les plus susceptibles d'�tre endommag�s par la lumi�re et qui, par cons�quent, n�cessitent des pr�cautions et une surveillance particuli�res. T�TULO—Nuevos estudios sobre el deste�imiento de veladuras transparentes: Cin�tica qu�mica y de apariencia. RESUMEN—Se describe el deste�imiento producido por la luz a veladuras transparentes desde dos perspectivas: primero, en funci�n de la p�rdida de colorante por reacci�n fotoqu�mica, despu�s en funci�n de los cambios de color que resultan de esta p�rdida de colorante. Los autores postulan que si 1 INTRODUCTIONThe fading of colors due to exposure to light is an inevitable consequence of exhibition, and minimizing those fading changes has become a central concern in preservation efforts. Because lighting judgments carry this risk of irreversible color change, it is reasonable to seek a deeper understanding of the process of light fading. With that knowledge, one might be able to recognize paint applications unusually sensitive to light exposure and be better equipped to sensitively monitor some attribute that signals the onset of rapid color change. Several efforts have been made to increase our understanding of the color and photochemistry in fading paints. These studies include the work by Johnston-Feller and Feller concerning the fading of alizarin crimson tints (Johnston-Feller et al. 1984; Feller et al. 1986; Johnston-Feller 1986) and of transparent glazes (Johnston-Feller and Bailie 1982; Johnston-Feller 1986) and the work of Thomson on the stratification of colorant in a fading glaze (Thomson 1965). These seminal contributions highlight the important physical or chemical principles that govern the fading of paints. While their focus was on specific processes or colorants, these studies defined many of the major trends and fading behaviors that can provide guidance in predicting the course of fading for a paint system. There will, of course, be exceptions to such generalizations, but precise prediction of the light sensitivity of any given paint application is an impractical goal. Instead, making judgments based on general behavior is a more realistic starting point for a preservation strategy. In this article we describe the optics and photochemistry of transparent glazes in order to outline the general course of fading in these paints (or, by analogy, in other transparent colored layers such as printing inks or plastics). We begin with a discussion of the optics of glazes, which not only impart their special appearance but also control the fading of the colorant within the layer. The combination of simple optical properties and simple photochemical reaction kinetics allows us to predict the colorant loss in a fading glaze. We then show that the colorant loss observed in the visible light fading of a glaze formulated with an organic red pigment, Pigment Red (PR) 66, is approximately that predicted by the simple model. This understanding of the photochemical reaction kinetics forms the basis for our description of the types and rates of appearance changes that will occur as the colorant is lost in a fading glaze. Just as the colorant loss is not generally steady with time, the color changes, particularly the loss of the high chroma that is the most distinctive quality of many glaze applications, are not steady with time. These ideas are summarized in terms of the It is essential at the outset to distinguish the measures used in this article to characterize the course and rate of the glaze “fading.” The term “fading” is usually taken to mean the light-induced alteration in the color of a material. While this process is generally associated with an increase in lightness (Munsell value), it has been shown that this color change is not necessarily the only one that can occur in fading transparent glazes (Johnston-Feller and Bailie 1982). The section devoted to what we call the “appearance kinetics” describes glaze fading in terms of these color changes and rates of color changes. Alternatively, the process of “fading” can also refer to the underlying photochemical reaction that leads to colorant loss. The section on chemical kinetics describes fading in terms of this reaction and characterizes it by the rate of colorant loss or, for processes that follow simple mathematical forms, by the so-called rate constants for the reaction. These rate constants are simply the parameters that uniquely define the mathematical form, for example, the slope of a line relating concentration to exposure. While each of these measures—the appearance changes, the concentration loss, and the rate constants for specific mathematical forms—is a valuable means of describing the fading process, it will be clear that one's impression of the course and rate of the process will depend on which of these measures is used. This point will again be made after the fading process has been examined from these different perspectives. 2 THE OPTICS AND APPEARANCE OF TRANSPARENT GLAZESWhether their function is to provide passages of high-chroma color, alter the hue of an underlying paint layer, or soften the transition between different colors, transparent glazes perform their function through their ability to selectively absorb, sometimes nearly completely, certain wavelengths of light while transmitting other wavelengths with little optical scattering. Glazes owe their special appearance qualities to the optical properties of the constituent colorants. In general, a “transparent” glaze is formulated with colorants that possess two features: selective absorption of certain wavelengths of visible light and weak scattering of those wavelengths that are not strongly absorbed. These properties allow glazes to be formulated or applied so that their transmittances (or reflectances over reflective substrates) are very low (near zero) at the absorbed wavelengths while remaining high at the wavelengths that are not absorbed strongly (fig. 1). The
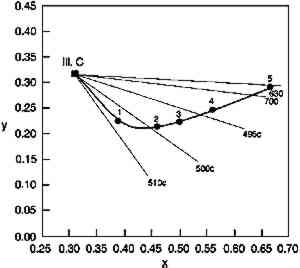
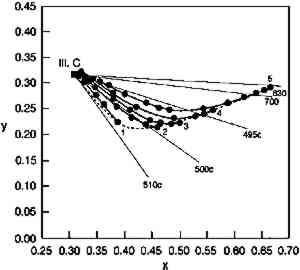
TABLE 1. MUNSELL NOTATION FOR GLAZES USED IN THIS STUDY While these are the most essential optical qualities of glazes, the Munsell notations shown in table 1 demonstrate that glazes also can display two other peculiar appearance properties. The hue of a glaze is actually a function of its colorant content; the PR66 glazes illustrate this phenomenon by shifting from a red-violet toward a red as the colorant loading increases. This shift occurs because the colorant absorption bands are usually defined by a reflectance minimum between spectral regions of higher reflectance, where the absorption strength is lower. At high enough colorant content, however, one region of higher reflectance may be reduced to essentially zero reflectance, and by eliminating the reflectance of these wavelengths the apparent hue of the glaze is shifted. For the PR66 glaze, the reduction of reflectance in the 400–500 nm region in the very dark glazes results in the hue shift from the purple of the pale glaze toward the red as the blue reflectance is reduced. This shift in hue of the PR66 glazes can also be seen in the chromaticity diagram of figure 2, which illustrates the shift in dominant wavelength (under CIE Illuminant C, simulating overcast daylight sky) from 506c (purple) to 630 nm (red) with increased colorant loading. (The lowercase “c” following the wavelength number denotes the “complementary” wavelength, following the convention of describing purples by the dominant wavelength of their complementary greens.)
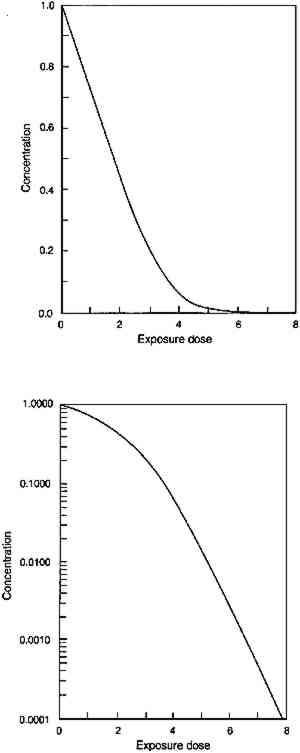
The other notable appearance change in glazes of different colorant concentration is the tendency of very dark glazes to display lower chroma. At very high pigment loadings, the weak absorption and scattering of the pigments slightly lower the reflectance at the nonabsorbed wavelengths. This reduction in the high reflectance spectral regions results in a lowering of the chroma of the glaze, demonstrated in the Munsell notations listed in table 1. Both the hue changes and the chroma changes with pigment loading have been noted by Johnston-Feller and Bailie (1982) and Johnston-Feller (1986). Both of these unusual appearance changes will be demonstrated in the fading of the glazes, in which the concentration of colorant is gradually reduced. However, because the fading does not produce a glaze having only lower pigment concentrations, the faded glazes do not reproduce exactly the appearance of the unfaded glazes at those lower colorant concentrations. 3 THE PHOTOCHEMISTRY OF GLAZE FADINGThe strong absorption of light in a restricted spectral region produces the distinctive appearance of transparent glazes. This same optical property also governs the photochemical reactions that result in the fading of the glaze. Photochemical reactions of colorants require absorption of light, and only the wavelengths of light that are strongly absorbed can cause fading of the colorant. It is often the case, too, that the rate of a photochemical reaction is proportional to the intensity of light that is incident upon the colorant (a dependence sometimes called the reciprocity principle). This dependence suggests that the rate of colorant loss in a fading glaze will be difficult to describe, for the colorant throughout a glaze is not exposed to a single incident light intensity. Rather, colorant at the surface of the glaze will be exposed to the incident light intensity, but because the surface layers absorb some of that light, colorant in subsurface strata of the glaze will be exposed to lower intensities. As a result, the colorant loss in a fading glaze will be greatest at the surface and will be progressively less at lower levels in the glaze. As pointed out by Thomson (1965), fading thus creates a stratification of the colorant in the glaze that depends on the varied light intensities within the layer. Partially absorbing glazes, which only absorb a fraction of the light intensity at the absorbed wavelengths, will fade throughout the glaze but more rapidly at the surface, where the light intensity is the highest: subsurface strata experience lower intensities because of the absorption of the upper strata. Strongly absorbing glazes, which absorb nearly all of the light in a spectral region, will fade only in a surface layer because the lower strata of the glaze see essentially none of the incident light of those wavelengths, and fading proceeds as the progression of the faded zone into the deeper layers of the glaze. This general protection of subsurface colorant by the absorption of the surface layers is a phenomenon known as the “filter effect” in dye fading (Giles and Forrester 1980). 3.1 CHEMICAL KINETICS OF GLAZE FADING: MODEL BEHAVIORTo fully describe the fading of a transparent glaze, one must consider the photochemical reaction within each individual stratum in the glaze. At each level, the light intensity will be whatever remains after absorption by the overlying layers of colorant, and the colorant in a specific stratum will be lost at a rate that depends on that local light intensity. The total colorant loss will be the sum of the losses in each individual stratum. At the next stage of fading, the new colorant distribution in the layer requires recalculation of the light intensities in each stratum, and so on to follow the course of the reaction. While laborious, such models have been devised, and the overall course of photochemistry in the stratified layers has been described This approach to modeling the loss of total colorant in a fading glaze is described in detail in Appendix 1. Some simplifying assumptions were made to provide a starting point for understanding the fading process. The most important of these assumptions are: that there is a single colorant that reacts to form colorless products; that there is a single rate constant for photochemical reaction that is not dependent on the wavelength of the absorbed light; and that the photochemical reaction rate for the total loss of colorant is dependent only on the amount of absorbed light. In this idealized glaze, one can easily predict the course of the total colorant loss and the key parameters that govern the rate of that loss. Assuming a single wavelength of incident light, the amount of visible light absorbed by the glaze (represented by its absorbance) reduces the amount of colorant in the glaze, a change that also decreases the absorbance. This faded glaze then absorbs a lesser amount of light, causing a smaller loss of concentration, and so on through the course of the fading. The concentration loss in such an idealized glaze absorbing a single wavelength of light has been calculated using equation 7 in Appendix 1; the result is shown in figure 3. An analogous calculation can be done
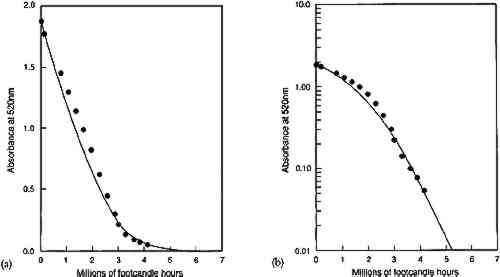
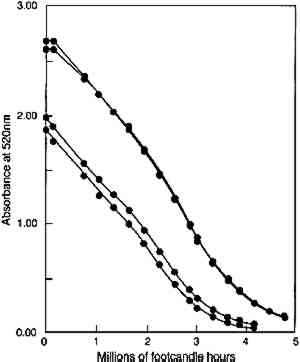
Figure 3 shows the predicted loss of colorant in an idealized glaze from absorption of a single wavelength of light. The result illustrates the key features of the concentration decrease during the course of fading. First, the model predicts that the colorant concentration should decrease at a linear rate for glazes that absorb the photochemically active wavelengths essentially completely, and the loss should approach an exponential decrease with light exposure as the glaze becomes more transparent at these wavelengths. The linear concentration loss (shown in fig. 3a) occurs in very dark glazes that absorb essentially all the light at wavelengths that will cause photochemical reaction. The slope of this linear colorant loss is dependent only on the light intensity, the film thickness, and the “quantum yield” of the reaction, or the efficiency for converting the absorbed light into faded colorant. This linear loss with time is a direct result of the dependence of the reaction rate on the amount of absorbed light. For very dark glazes, colorant loss has little effect on the absorption of light, which remains nearly complete at the absorbed wavelengths: in fact, colorant loss in these glazes will occur only in a thin region at the glaze surface. As colorant loss proceeds, the slope of the concentration change eventually begins to deviate from a linear time dependence. For the calculation of figure 3, this deviation occurs at about 2 units of exposure. At this point, the colorant loss begins to cause a decrease in the absorbance at the strongly absorbed wavelengths and thus a reduction in the reaction rate. For paler glazes, colorant loss reduces the amount of light absorption, and further fading occurs at progressively slower rates as the absorption decreases. As shown in Appendix 1, this loss eventually becomes a “first-order” chemical reaction in which the rate depends on the colorant concentration (which in turn is proportional to the light absorbance). The mathematical form describing this behavior is an exponential curve whose exponent contains the first-order rate constant for the colorant reaction. Figure 3b shows the semilogarithmic plot of the colorant loss in figure 3a, and the linear portion of the colorant loss (at exposure times above about 5 units) represents an exponential decrease, with the slope of the line equal to the exponent. In this case, the exponent approaches the value of the intrinsic photochemical reaction rate constant for the colorant that was originally assumed in the model. In other words, only when the glaze has faded to a midrange reflectance (when the reflectance over white has reached about 50% or greater at the absorption maximum) does the reaction proceed at the intrinsic rate of the colorant reaction. Only then do the chemical kinetics resemble those of the underlying “local” photochemistry and are not altered as a result of the “filter effect.” This finding is in accord with the recommended practice for investigating “local” photochemical reaction kinetics from measurements of overall reaction rates (Calvert and Pitts 1966, 640–42). In addition to the time dependence of the colorant loss for glazes, there is one other important prediction that comes from the assumptions built into this model. Since it is only the absorbance of the film (or equivalently, the amount of colorant) that enters into the model, this description implies that the details of the colorant distribution are irrelevant to the course of the fading. This relationship means that thick layers of dilute colorant should fade at the same rate as thin layers of more concentrated colorant, provided the absorbances are equal. Similarly, previously faded glazes (having a nonuniform concentration distribution) should fade at the same rate as unfaded glazes (with a uniform colorant distribution) having the same absorbance. 3.2 CHEMICAL KINETICS OF GLAZE FADING: COMPARISON WITH EXPERIMENTExperiments were performed on glazes of PR66 to demonstrate the extent to which this simple idealized behavior can be observed. This organic pigment was selected because it had been observed to be moderately fugitive upon exposure to visible light. The procedures are summarized in Appendix 2, and the results are shown in figures 4–6. Figure 4 shows the concentration loss in glaze 2, which prior to exposure absorbs essentially all of the light at the wavelength of maximum absorption (see fig. 1). The solid curves in figures 4a and 4b are calculated from the kinetic equation (7) described in Appendix 1. It can be seen in figure 4a that the rate of concentration loss is nearly constant with exposure—that is, the loss is approximately linear with exposure—until about 3 million footcandle hours (Mfchrs) dose, when the loss begins to decelerate markedly. In figure 4b the same data are plotted on a semilogarithmic scale, where it can be seen that the concentration loss after about 3 Mfchrs approaches an exponential decrease (i.e., linear on a semilogarithmic plot). This point at which the concentration loss begins to approach exponential behavior is also approximately the point at which the glaze becomes measurably less absorbing at the absorption maximum. Although only the results for glaze 2 are shown, the fading of the other glazes in the series shows the same general agreement with the predicted fading. Despite the relatively minor deviations from the ideal behavior, the overall course of the colorant loss seems to follow quite well the trends expected on the basis of the simplified kinetic model.
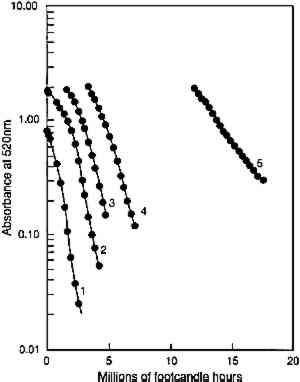
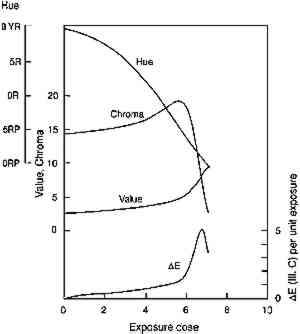
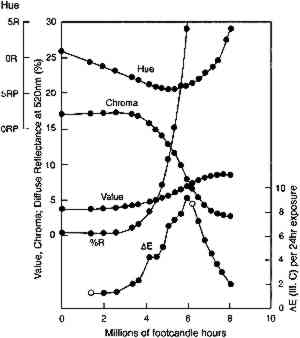
In figure 5, experimental results are presented that test the model prediction that the rate of colorant loss should depend only on the amount of light absorbed and not on the concentration distribution within the film. Pairs of fresh glazes were faded. Each member of the pair had similar absorbances, but one was made as a thin film When the same comparison is made of the fading of fresh, unfaded glazes and of previously faded glazes of the same absorbance, however, the results are not those expected on the basis of the model. Figure 6 shows the exponential fading of the set of glazes (i.e., linear colorant losses on a semilogarithmic plot), and it is clear that while closely matched glazes share nearly identical exponential decreases, the concentration losses are slower for those glazes that have experienced a greater amount of prior fading. The rate constants for this fading (i.e., the exponents of the exponential losses) are listed in table 2. When the darkest glaze (glaze 5) has faded to an intermediate absorbance of about 1, its further fading is only 20% of the rate of a fresh glaze (glaze 1) having an initial absorbance of 1. This behavior may illustrate the intuitive notion, based on some experience, that older colorants seem more resistant than fresh ones to further fading. TABLE 2. RATE CONSTANTS FOR EXPONENTIAL CONCENTRATION LOSSES SHOWN IN FIGURE 6 Despite these deviations from idealized behavior for very faded glazes, the experimental results presented here nevertheless suggest that the essential features of the photochemistry in a fading glaze are adequately included in the simple model described. While neglecting the details of the optics of the glaze, especially as it fades to create nonuniform colorant concentrations, the overall kinetics of the total concentration loss, and the resultant change in optical absorbance and reflectance, seem to be predicted well. This model also suggests, and the experimental results demonstrate, that for the simple glaze system described, fading will depend largely on the glaze's present color (or absorbance) and to a much lesser extent on the details of its formulation (specifically, its pigment loading). The experimental results do suggest, however, that the rate of fading may depend to some extent on the glaze's prior fading history. While the model presented above offers valuable insights into the photochemical kinetics of the glaze fading and provides important predictions of trends expected for simple systems, the most important measure of the light sensitivity of a glaze is still the rate at which its appearance changes from light exposure. In the next section we will explore how our picture of the underlying chemistry can help our understanding of the color changes that accompany the colorant losses. In particular, we seek trends that allow the identification of glaze applications that are at high risk of light-induced color changes and of the measurements that might provide the most useful indicators of those changes. 4 APPEARANCE KINETICS OF GLAZE FADING4.1 MODEL BEHAVIORAs a first approximation one can consider that loss of colorant in a glaze will produce exactly the same color changes that occur when a glaze is formulated with progressively smaller colorant loadings. For an initially dark glaze, one may expect a chroma increase accompanied by a hue shift (from increased reflectance at wavelengths off the peak absorption), followed by the chroma loss and value increase normally associated with “fading” as the reflectance of the main absorbed wavelengths begins to increase. These color changes have been described in previous reports concerned with the appearance changes in fading glazes (Johnston-Feller and Bailie 1982; Johnston-Feller 1986). However, it is important to realize that these changes will not occur steadily with time, and our understanding of the chemical kinetics of the colorant loss allows us to estimate the “appearance kinetics,” or the rates at which appearance changes will be likely to occur. The progression of color changes during photochemical destruction of the colorant will provide a clearer picture of the changes observable during the light exposure of the film. Thus, it will be possible to recognize the periods during which the most serious color The appearance kinetics are estimated by calculating the spectral changes (and subsequently the color attributes) in a glaze that is photochemically reacting as modeled in the previous section, assuming absorption of a range of wavelengths. The fading of an idealized red glaze having an absorption spectrum similar to PR66 has been calculated, and the incomplete-hiding Kubelka-Munk formulas (Judd and Wyszecki 1975, 426–28) were used to derive the changes in the reflectance spectrum (assuming a white substrate) and in the color (using the usual procedures, outlined in Appendix 2, to derive tristimulus values, color differences, and Munsell notation) due to the colorant concentration loss. The changes in Munsell notation are shown in figure 7. As seen in the colors of the fresh glazes, the colorant loss in the initially dark glaze at first results in an increase in the reflectance at the blue wavelengths (just to shorter wavelengths from the absorption maximum). As the blue reflectance increases, the hue shifts from red toward purple. In fact, this hue shift appears to be the most prominent color change in the dark glaze as it fades. At the same time the chroma, which is initially quite high for this model glaze, increases because of the greater difference between the levels of low reflectance (at the absorption maximum) and high reflectance (at the long wavelengths). When the colorant concentration is lowered so much that the reflectance at the peak absorption wavelengths begins to increase, then pronounced and rather sudden color changes occur, notably a decrease in chroma and an increase in value. It is worth noting that the color changes normally connoted by the term “fading” are evident only at this stage, when the reflectance is increasing across the entire spectrum. For darker glazes, colorant loss produces only slight changes in chroma and value.
The rapidity of the color changes once this stage
Clearly, with larger reflectance changes being produced for glazes having intermediate reflectance minima, the rate of color change will not be constant during the light exposure. As glazes acquire such intermediate reflectance minima they will display a much greater light sensitivity. This sensitivity can be measured by calculating the color difference produced by a unit of light exposure, termed here the “incremental” color difference. This quantity merely sums the changes in color attributes to get a single approximate amount of perceived color change for a unit of exposure (see Appendix 2 for references to the standard formulas used). The incremental color difference (ΔE per unit exposure dose) has been calculated for the fading ideal red glaze and is shown at the bottom of figure 7. This picture represents the relative light sensitivities of glazes formulated at different colorant concentrations. The darkest glazes lose colorant at the maximum (linear) rate, yet the color change is slight because little spectral change results. For the same amount of light exposure, a glaze having a reflectance minimum of about 20% (over white) will experience much larger color differences (5–10 times greater in this calculation), a difference in perceived lightfastness of as much as three blue wool steps (Feller 1975, 1978; Thomson 1978, 174-75; Feller and Johnston-Feller 1981). This result indicates that the glaze formulations of maximum light sensitivity will tend to be these glazes having intermediate reflectance minima (viewed over white). In addition to providing a picture of the relative light sensitivities of glazes having different colorant concentrations, this view can also be interpreted as the fading of a single dark glaze occurring in three stages. While losing concentration at the maximum (linear) reaction rate, a highly absorbing glaze will experience only slight color changes due to the reflectance changes away from the absorption peak. As the glaze fades so that the absorbed wavelengths are less highly absorbed, the colorant loss slows, but the magnitude of the color change increases. As the glaze passes through a stage when its reflectance at the absorption maximum is intermediate 4.2 COMPARISON WITH EXPERIMENTThe color changes that occur during visible light exposure of PR66 glazes were measured experimentally to determine the extent to which these predicted appearance kinetics were followed. Figure 9 shows the change in Munsell hue, value, and chroma as a moderately dark glaze faded. The predicted hue shift from red toward purple is apparent in the early stage of the exposure. The hue begins to shift back toward the red in the later stage because of the apparent formation of a product, or the preferential fading of a component, that causes the glaze to fade “off shade”: that is, the faded glaze is slightly redder than the unfaded glaze that has the same lower colorant content (behavior also reflected in the chromaticity coordinates in figure 10). The chroma shows the predicted slight increase during the exposure, followed by a rapid decline. The Munsell value is also relatively constant until experiencing a gradual increase coincident with the chroma loss. These sudden changes in chroma and value occur when the glaze becomes only partially absorbing at the
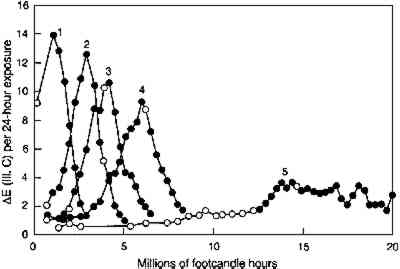
Just as the previously faded glazes showed slower rates of concentration loss than unfaded glazes of the same concentration (see fig. 6), so too do the previously faded glazes show lower relative light sensitivities (as measured by the incremental color difference) than the unfaded glazes of the same colorant concentration. Figure 11 shows the incremental color differences of several glazes of different initial colorant contents (glazes 1–5, in order of increasing content) as they fade to acquire an intermediate reflectance at the wavelength of maximum absorption. The maximum light sensitivity is seen for the initially palest glaze, and the initially darker glazes display progressively lower peak sensitivities as they become pale. In other words, as measured by their color changes, previously faded colors seem to be somewhat less sensitive than the fresh glazes of the same color. The relative sensitivities are approximately the same as the relative rate constants for the colorant loss for those glazes, as listed in table 2, with the darkest glaze being about five times less light sensitive than the initially pale glaze when both are at maximum
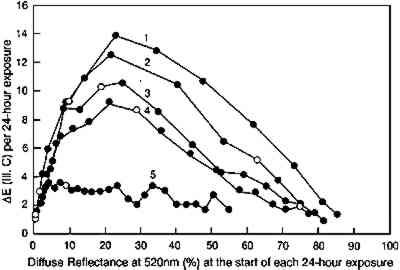
A more complete picture of the changes in lightfastness that occur as the glazes fade is shown in figure 12, in which the incremental color differences are plotted as a function of the depth of shade of the glaze. In this figure the color difference produced by each 24-hour light exposure is plotted against the depth of shade (measured by the reflectance at 520 nm, the wavelength of maximum absorption) at the start of the 24-hour exposure period. This illustration tracks the light sensitivity for the glazes as they fade and shows that sensitivity peaking for glazes having minimum reflectances of about 20%. This plot also shows the lower light sensitivities of the glazes that have been faded to varying degrees to reach the same depth of shade (i.e., the same reflectance at the wavelength of maximum absorption). The glaze that had experienced the most fading to reach this intermediate reflectance level (glaze 5) experienced color changes about five times smaller than the glaze that experienced little prior fading (glaze 1).
It is important to recognize that the behavior demonstrated here—that paler glazes have greater light sensitivities than dark glazes—was observed and noted long ago in the case of textile dyes. Barker et al. (1927) reported this behavior, writing at the time that the effect was already well known, and since then others have published experimental results for dyed textiles or cellulosic films that are similar to the results reported here for pigmented glazes (Cunliffe and Lambert 1932). While some of these observations are believed to result from effects peculiar to dyed materials (such as the aggregation of dye particles that decreases the dye's light sensitivity), the optical origins for this effect also came to be recognized. Morton (1949) was among the first to describe the mechanism of the observed “filter effect” behavior. It is worth noting, though, that Morton concluded that “pale” shades are 1–2 lightfastness grades more fugitive than “medium” shades, which are 1–2 grades more fugitive than “dark” shades, while in our study the glazes having reflectance minima (over white) of about 20% at the wavelength of peak absorption are more fugitive than either darker or paler glazes. The apparent discrepancy probably arises from the terms denoting the depth of shade: for textile dyers, “medium” dyeings, according to Morton (1949), absorb 99% of the light at the absorption peak, which would correspond more closely to the dark glazes studied in this work. The glazes having 20% reflectance minima described in this article are probably comparable to the “pale” textile dyeings, and these glazes are indeed more light sensitive than the darker shades. Textiles dyed to the equivalent of the pale glazes, which show slightly greater lightfastness than the glazes having 20% reflectance minima, were probably so pale that they were not studied in the textile research. Later work in this field, particularly that described by Stearns (1969, 32–38), supports the notion of greater sensitivity for colors having intermediate reflectance minima. In fact, Stearns calculated the incremental color changes for a textile dyed with four different dyes, and he predicted the maximum sensitivity for those systems having reflectances of about 20% at the peak absorption wavelengths, a result that is in accord with both the calculations and the experimental observations in the present study. Textile chemists have also reported the slower fading of previously faded colors. Morton (1949) attributed this characteristic to the formation of colored products of fading, which absorb the light and protect the remaining colorant by a type of “filter effect.” Giles and Forrester (1980) suggest another possibility, that the pigment is a blend of materials having slightly different lightfastness (by virtue of different particle sizes, for example). The fresh material would be more fugitive because it contains more of a fugitive component, while the material that has undergone some prior fading would be depleted in that component; 5 SUGGESTIONS FOR MONITORING THE COLOR STABILITY OF GLAZESFor the paint or textile industry seeking to determine the lightfastness of a material, testing can be done to measure slight color changes in carefully standardized materials, thus avoiding complicated fading behaviors and the dependence on factors such as the depth of shade. Conservators face the exact opposite of this idealized situation, in which the materials in a collection will inevitably vary widely in their color and in their prior fading history. Even knowing the pigments in a paint, one can probably only estimate to within a few grades the actual lightfastness of any given application (in other words, one may only be able to estimate the fading rate to about a factor of 10). With such a wide range of possible light sensitivity, it is exceedingly difficult to make any but an informed guess as to whether extensive fading will result from exhibition under specified lighting conditions. This is a particularly troublesome situation when the lighting conditions cannot be altered substantially and the decision is essentially whether or not to exhibit an object. In response to this situation some institutions have considered implementing programs to carefully track the color of exhibited objects in order to assess the actual lightfastness of the materials and to better judge the consequences of exhibition. Aside from the technical challenge of making precise color measurements periodically at long intervals, such efforts often force some selection of objects or colored materials in order to make such a monitoring program practical. With this in mind it is useful to consider whether one can choose those types of paint applications that might be most at risk from light damage and thus be sensible targets of a color monitoring program. The experiments described in this article indicate that for a given colorant, glazes having intermediate reflectance minima will tend to display the largest color changes upon fading. For glazes that are already only partially absorbing across the spectrum, almost any property (if measured precisely) can reliably track the progress of fading. Color differences (ΔE); changes in lightness (ΔL∗), tristimulus values, or Munsell chroma or value; or changes in reflectance at the absorption peak or across the spectrum will all be sensitive and reliable indicators of color stability. For the high chroma glazes that reflect very little of the light at the absorbed wavelengths, on the other hand, many of the usual measures to indicate color changes may not be sensitive to the colorant fading. Colorant loss in these glazes does not result in the conventional appearance changes associated with “fading” but instead results in hue shifts or chroma increases. These changes will be much less distinct than the value increase or chroma decrease in fading glazes having intermediate reflectance minima. The quantities that change for dark glazes (such as the high chroma) may be difficult to measure precisely, or they may be affected by the details of the colorant reaction (such as the hue shift). The best monitor for the colorant loss in these highly absorbing glazes over light-colored substrates may be the measurement of changes in the entire reflectance spectrum. The relative precision of the spectral measurements should allow a good determination of changes in the profile that reflect the progress of the fading. This profile may also be the best indicator for when the reflectance of the absorbed wavelengths is about to rise above nearly zero (i.e., when the rapid second stage of fading is imminent). Another possibility to track the course of fading is to monitor the reflectance at a wavelength on the side of the absorption peak, where the reflectance is greater than zero. Here the reflectance will increase before changes can be observed at the peak absorption wavelengths. In fact, it was only by measuring the reflectance at these off-peak wavelengths that the chemical While the glazes that are on the verge of the rapid second stage of fading do not display the greatest light sensitivity, it can be argued that they are most at risk of suffering objectionable light-induced damage. These glazes still have a high chroma and low value (i.e., they retain the appearance that probably motivated the choice of a glaze application in the first place). Further fading will put them at risk of entering the more rapid fading stage, when chroma will decrease and value will increase. Identifying these glazes (by their just barely saturated absorption peaks) and tracking the course of their fading and the approach of the rapid second stage of fading should be considered priorities for color monitoring programs. Again, the profile of the entire reflectance spectrum will be most useful for judging how saturated the absorption peak is. Finally, it is tempting to interpret the results of this study as justification for assuming a greater stability for old, previously faded glazes, but it would be premature to use this study alone as the basis for such an assumption. The glazes tested here did in fact show lower sensitivities after prior fading, even as those glazes entered into the more rapid second stage of fading (figs. 11 and 12), perhaps through protection by the fading reaction products or through having already lost the most fugitive pigment components. Without much more study, however, it is not possible to assess how much more stable faded glazes of other colorant formulations may be, particularly those traditional organic colorants whose composition, and thus stability, may depend on the detailed chemistry of a plant or animal source. Further, it is impossible to judge accurately from the appearance of a glaze how much fading it may have experienced in the past, and in this study this characteristic was a determinant of the light sensitivity. While it would thus be imprudent to assume a greater durability for previously faded glazes and to exhibit them at higher light levels or for longer periods, it may still be sensible to make such glazes lower priority targets for color monitoring programs. Fresh, unfaded glazes, which retain a high chroma and may be on the verge of the rapid second stage of color change, may be more at risk and make more reasonable subjects for color monitoring. 6 CONCLUSIONSIn this paper a simple model that describes the essential features of the photochemical reaction in a transparent glaze has been developed and tested. The rate of colorant loss is assumed proportional to the total amount of light absorbed, and this rate predicts the observed concentration loss that is linear with exposure dose for highly absorbing glazes, progressively slowing to an exponential loss with exposure dose for partially absorbing glazes. This model also predicts that only the glaze absorbance determines its fading rate and not the colorant concentration or distribution. Thus film thickness and prior fading should not affect the observed colorant loss rate. In experiments on PR66 glazes, this predicted behavior was observed: the colorant loss was found to be dependent on the total amount of colorant in the glaze layer and not on its thickness or colorant concentration. However, previously faded glazes seemed to react more slowly to light exposure than fresh glazes having the same concentrations. The reasons for this behavior are unknown, but it has been observed in studies of textile dye fading. It is not clear that this is a general phenomenon, but because of its implications for the preservation of artifacts, it merits further investigation. In contrast to the photochemical reaction kinetics, the color of the fading glaze does not show steady evolution but rather a distinct series of stages. The fading of the highly absorbing glazes produces small steady color changes that, because they are caused by the optical properties away from the main absorption peak, may not resemble “fading”: hue or chroma changes may be the most easily perceived. Once fading has progressed so that the reflectance of the absorbed wavelengths is in the middle range, the second stage of fading produces much larger rates of color changes that will tend to derive from the chroma loss and value increase more It is worth noting that the chemical kinetic and appearance kinetic descriptions of the glaze fading offer different views of the “fading rate,” and in fact this term can only have meaning when the measure of fading has been described. Measured by the colorant loss, the fading is seen to be steady (i.e., linear with exposure). As the colorant loss becomes exponential with time, the loss can be accurately described as becoming progressively slower. However, a chemist may choose to describe the photochemistry as a local first-order process that is slowed by the filter effect in the highly absorbing glaze and approaches the reaction rate of the isolated molecules as the glaze becomes very transparent. This view would describe the increase of the first-order reaction rate constant (the slope of the semilogarithmic plot of fig. 3b) as the speeding up of the overall first-order reaction. In contrast to these chemical descriptions, one could accurately describe the fading of a highly absorbing glaze in terms of its appearance changes, which progress slowly in a dark glaze, then reach a point when the color changes speed up, then finally slow down as the glaze becomes completely faded. Each of these descriptions of the “fading rate” is correct and useful, but clearly confusion results unless one specifies the measure being used to track the process. While the most common usage in conservation is to refer to the appearance changes as the most relevant and important measure of the course of fading, it has been demonstrated here that there is no simple connection between the appearance changes and the chemical changes. Finally, it is appropriate to note the obvious limitations of applying this description to glazes that occur on paintings. The model described here presents the simplest picture of the fading of a transparent glaze. Glazes that do not conform to the assumptions of this model, such as green copper resinate glazes that turn brown on light exposure, are likely not to conform to the general trends described here. Faded glazes composed of mixtures of colorants (or of natural colorants that are themselves mixtures) may have greater resistance to light than equivalent “fresh” glazes simply by virtue of their having already lost the more fugitive components of the mixture. The glaze fading model was developed not to attempt accurate description of all possible glaze applications. Rather, it is presented as a starting point for estimating the likely fading of a paint about which there may be little other information. The trends discussed should be considered a guide that may help in developing appropriate, prudent exhibition conditions and as an aid in directing efforts to monitor the condition and possible sensitivity of such paints. APPENDIX1 APPENDIX 11.1 MODEL FOR THE FADING OF TRANSPARENT GLAZESIn developing the general kinetic law for the fading of a transparent glaze, we adopt the approach of Malac (1989), in which the rate of total colorant loss is determined by the total amount of photochemically active light absorbed. This model rests on a number of simplifying assumptions, and later we discuss the extension of these kinetics to more general systems. We begin by assuming:
The loss of colorant per unit time is equal to the light flux (in moles of photons per unit time) incident on the colorant, multiplied by the
This expression indicates that the loss of colorant concentration will generally be proportional to the fraction of incident light absorbed by the film (represented by α). This relationship suggests two results: The concentration loss rate in very highly absorbing glazes will be constant as long as the absorption strength does not change during the fading; and the loss rate will become progressively smaller as the fading proceeds and the light absorption by the glaze decreases. A more explicit analysis of these cases reveals the relationship between the fading for these extreme cases. For transparent glazes illuminated with collimated light making a single pass through the film, the absorbed fraction of light can be expressed using Beer's law: α = 1 − e−KCX where K is the molar absorption coefficient. So the kinetic relation (3) becomes:
For very highly absorbing glazes (optically thick), all of the incident light is absorbed by the glaze (α = 1, or alternatively KCX is very large and e−KCX = 0), and a small concentration loss does not appreciably alter the amount of light that is absorbed. The kinetic expression for the overall concentration loss becomes:
In these glazes, the upper layers of colorant completely absorb the photochemically active wavelengths and fade while effectively protecting the underlying strata. This process has been observed in dye fading in films and textiles and has been dubbed the “layer effect” or the “filter effect.” Giles has reviewed the major observations and descriptions of this phenomenon in dye studies (Giles and Forrester 1980), and this same behavior has been alluded to in the analysis of the fading of very highly absorbing glazes by Johnston-Feller (1986). For glazes that absorb only a fraction of the photochemically active wavelengths of incident light, the exponential term in equation 4 can be approximated e−KCX ≅ 1−KCX), and the kinetic relation becomes:
This approximation for the exponential term is reasonable for KCX < 0.3, that is, for glazes having transmittances above about 75%. Equation 6a describes a rate of colorant loss that is proportional to colorant concentration: each increment of fading will cause the glaze to absorb slightly less light, causing the subsequent reaction to occur more slowly. This is an example of a so-called “first-order” reaction, and for such a process the concentration decreases exponentially with time:
It is valuable to examine the relationship between the zero-order rate constant of the “thick” glaze fading and the first-order rate constant of the “thin” glaze fading. One can see that the zero-order rate constant (i.e., the slope of the linear fading of the thick glaze) is equal to the first-order reaction rate constant divided by K X (the product of absorption coefficient and film thickness). Thus one can recast the general kinetic expression of equation 3 in terms of this first-order reaction rate constant:
At this point, it is appropriate to examine the validity of the original simplifying assumptions that were the basis for this description. The most obvious restriction of the model is its presumption of monochromatic illumination that allows the use of absorption coefficients and quantum yields of reaction for a single wavelength. Strictly speaking, the model can be extended to describe fading due to polychromatic illumination (far more typical of gallery lighting) by summing the effects of each wavelength (that is, the appropriate absorption coefficients and quantum yields) across the spectrum. This approach is similar to that used by Krochmann (1988) and necessitates the measurement of reaction rates due to absorptions at different wavelengths. It seems likely, however, that this fineness of detail may be unnecessary for describing fading due to absorption in a single broad spectral peak, which probably can be adequately described according to an average quantum yield for reaction due to absorption in that peak. As long as the description is thus restricted to illumination with a visible light source, so that the fading due to visible and ultraviolet wavelengths need not be summed, the above treatment should be adequate if the average values of absorption and reaction probabilities are used. Another assumption in this The assumption of collimated light incident on the glaze film is also an inaccurate representation of the combination of diffuse and oblique collimated light often used to illuminate objects. Similarly, glazes are usually viewed over a reflective and optically scattering substrate, and the light fluxes within the film are expected to more closely approximate diffuse fluxes than collimated ones. It has been pointed out by many authors that the absorption coefficient of diffuse light is about twice that of collimated fluxes, probably by virtue of the greater absorption path length for the light traveling at oblique angles in the film (Beasley et al. 1967). As a result, the kinetic behavior for fading of glazes illuminated by diffuse light should be the same as for collimated light, with the absorption coefficients doubled. Also, since the model assumes that the light intensity distribution has no effect on the rate for the total colorant loss, the model should adequately describe fading of a glaze on a reflective substrate. For these reasons, the simple model that has been described is expected to allow at least qualitative predictions of the course of fading of a glaze under any given illumination and also to allow semiquantitative comparison of different glaze formulations when exposed to the same illumination. 2 APPENDIX 2: EXPERIMENTGlazes of known pigment loadings were prepared by first ball milling for 3.5 days dry Pigment Red 66 (Colour Index No. 18000:1, a barium salt of an azo dye) in a xylene/toluene solution of poly(vinyl acetate) (PVA). The proportions of pigment, resin, xylene and toluene in this base paint were 2.83:37.04:47.10:13.00 by weight. This pigment dispersion was mixed in varying proportions with a 44% by weight solution of PVA in xylene in order to produce transparent paints of the desired pigment concentrations. Two paints were prepared: one, used to make glaze 5 and the thin glazes in figure 5, produced dry films at a pigment volume concentration (PVC) of 1.14% (2.24% pigment by weight of dry film), and the other, used for glazes 1-4, produced films having 0.68% PVC (1.34% pigment by weight). These transparent red paints were applied to 2.5 � 7.6 cm glass microscopes slides that had been precoated with layers of titanium white paint (in PVA) at complete hiding. The red paints were drawn down using a doctor blade on the white substrates at varying thicknesses to achieve the desired depth of shade for the glazes. The glazes were exposed in a commercial fading apparatus that employs a xenon light source, filtered to eliminate infrared and short ultraviolet wavelengths, and a parabolic reflector. Collimated light was directed onto a water-cooled sample tray held at 20�C with a recirculating water chiller. An additional filter consisting of a 3.2 mm thick sheet of ultraviolet-absorbing Plexiglas (UF-3) was placed just above the samples so that only visible wavelengths were incident upon them. Visible light intensity during the exposures was 12,600 footcandles (1.36 � 105 lux), and ultraviolet light intensity (between 300–400 nm wavelength) was 1.56 � 10−4 watts/cm2, as measured at the sample position with a radiometer. Reflectance spectra of the glazes were measured periodically during the exposures using a spectrophotometer. Measurements at 20 nm wavelength intervals were made both with the specular reflection included (for chemical kinetic analysis) and excluded (for color analysis). From these experimental data and from the model reflectance spectra of ideal red glazes, tristimulus values (X,Y,Z) were calculated for CIE standard illuminant C using the standard formulas and tables. These values were in turn used to calculate Munsell notations (hue, value, ACKNOWLEDGEMENTSThis work was performed at the Research Center on the Materials of the Artist and Conservator at Carnegie Mellon University and was supported by a grant from the Andrew W. Mellon Foundation. The authors also thank R. Roberts of Sandoz Chemicals Corp. (now Clariant Corp.) for kindly supplying the Pigment Red 66 and Hugh Davidson of Davidson Colleagues for the color-analysis computer software. REFERENCESBarker, S. G., H. R.Hirst, and P. N.Lambert.1927. Relation between initial depth of shade and loss of colour due to fading. Journal of the Society of Dyers and Colourists43: 264–66. Beasley, J. K., J. T.Atkins, and F. W.Billmeyer. 1967. Scattering and absorption of light in turbid media. In Electromagnetic scattering, ed.R. L.Rowell and R. S.Stein. New York: Gordon and Breach Science Publishers. 765–85. Calvert, J. G. and J. N.PittsJr.1966. Photochemistry. New York: John Wiley and Sons.
Clough, R. L., K. T.Gillen, and C. AQuintana. 1985. Heterogeneous oxidative degradation in irradiated polymers. Journal of Polymer Science: Polymer Chemistry Edition23: 359–77. Cunliffe, P. W., and P. N.Lambert. 1932. The measurement of the colour of dyed textiles IX: The influence of the concentration of dyestuff and the time of exposure on fading. Journal of the Society of Dyers and Colourists48: 59–66. Feller, R. L.1975. Studies on photochemical deterioration. In ICOM Committee for Conservation Preprints, 4th Triennial Meeting, Venice. Paris: ICOM. 75/19/4/1–8. Feller, R. L.1978. Further studies on the international blue-wool standards for exposure to light. In ICOM Committee for Conservation Preprints. 5th Triennial Meeting, Zagreb. Paris: ICOM:. 78/18/2/1–10. Feller, R. L., and R. M.Johnston-Feller. 1981. Continued investigations involving the ISO blue-wool standards of exposure. In ICOM Committee for Conservation Preprints. 6th Triennial Meeting, Ottawa. Paris: ICOM: 81/18/1/1–7. Feller, R. L., R. M.Johnston-Feller, and C.Bailie. 1986. Determination of the specific rate constant for the loss of a yellow intermediate during the fading of alizarin lake. Journal of the American Institute for Conservation25: 65–72. Giles, C. H., and S. D.Forrester. 1980. Physical factors affecting the light stability of dyed and pigmented polymers. In Photochemistry of dyed and pigmented polymers, ed.N. S.Allen and J. F.McKellar. London: Applied Science Publishers. 51–91. Gutierrez, A. R., and R. J.Cox. 1986. Maximizing light absorption at the bottom of a film. Polymer Photochemistry7: 517–21. Johnston-Feller, R. M.1986. Reflections on the phenomenon of fading. Journal of Coatings Technology58(736): 32–50. Johnston-Feller, R. M., and C. W.Bailie. 1982. An analysis of the optics of paint glazes: Fading. In Science and technology in the service of conservation, ed.N. S.Brommelle and G.Thomson. London: International Institute for Conservation of Historic and Artistic Works. 180–85. Johnston-Feller, R. M., R. L.Feller, C. W.Bailie, and M.Curran. 1984. The kinetics of fading: Opaque paint films pigmented with alizarin lake and titanium dioxide. Journal of the American Institute for Conservation23: 114–29. Judd, D. B., and G.Wyszecki. 1975. Color in business, science and industry. 3d ed.New York: John Wiley and Sons. Krochmann, J.1988. Illumination of light-sensitive display pieces with special consideration to their damage by optical radiation. Restauro3: 227–34. Malac, J.1989. Photochemistry in well-mixed and in stationary layers: Case 1. Polymer Degradation and Stability26: 57–63. McLaren, K.1956. The spectral regions of daylight which cause fading. Journal of the Society of Dyers and Colourists72: 86–99. Morton, T. H.1949. The practical assessment of the light fastness of dyeings. Journal of the Society of Dyers and Colourists65: 597–605. Reiser, A., and E., Pitts. 1976. Characteristic curve of crosslinking photoresists. Photographic Science and Engineering20: 225–29. Saunders, D., and J.Kirby. 1994. Wavelength-dependent fading of artists' pigments. In Preventive conservation: Practice, theory, and research, ed.A.Roy and P.Smith. London: International Institute for Conservation of Historic and Artistic Works. 190–94. Stearns, E. I.1969. The practice of absorption spectrophotometry. New York: John Wiley and Sons. Thommes, G. A., and V. J.Webers. 1985. Spectral response of photosensitive systems. Part 1, General effect of radiation attenuation throughout coating thickness. Journal of Imaging Science29: 112–16. Thomson, G.1965. Topics in the conservation chemistry of surfaces. In Application of science in the examination of works of art. Boston: Museum of Fine Arts. 78–85. Thomson, G.1978. The museum environment. London: Butterworths. FURTHER READINGBillmeyer, F. W., and M.Saltzman. 1981. Principles of color technology. 2d ed.New York: John Wiley and Sons. SOURCES OF MATERIALSColor-analysis computer softwareDavidson Colleagues, P. O. Box 490, Tatamy, Pa. 18085 Graphtol Red 1630–1 (Pigment Red 66, Colour Index No. 18000:1)Sandoz Chemicals Corp. (now Clariant Corp.), 4000 Monroe Rd., Charlotte, N.C. 28205 Light exposure apparatus (Suntest CPS)Atlas Electric Devices Co., 4114 North Ravenswood Ave., Chicago, Ill. 60613 Poly(vinyl acetate) (Vinac B-7)Air Products and Chemicals, Inc., 7201 Hamilton Blvd., Allentown, Pa. 18195 Radiometer (IL1700)International Light Neslab Instruments, Inc., P. O. Box 1178, Portsmouth, NH 03802 Spectrophotometer (Color Eye Model 1500)Macbeth Division, Kollmorgen Instruments Corp., 405 Little Britain Rd., New Windsor, N.Y. 12553 Titanium white (Ti-Pure R-960)Du Pont Co., White Pigment and Mineral Products, 1007 Market St., Wilmington, Del. 19898 UF-3 PlexiglasTALAS, 213 W. 35th St., New York, N.Y. 10001 AUTHOR INFORMATIONPAUL WHITMORE received a Ph.D. in physical chemistry from the University of California at Berkeley. Following an appointment at the Environmental Quality Laboratory at Caltech studying the effects of photochemical smog on works of art, he joined the staff at the Center for Conservation and Technical Studies at the Harvard University Art Museums. Since 1988 he has been director of the Research Center on the Materials of the Artist and Conservator at Carnegie Mellon Research Institute, where his research has been directed toward the study of the permanence of modern art and library materials. Address: Carnegie Mellon University, 4400 Fifth Ave., Pittsburgh, Pa. 15213. CATHERINE BAILIE has an A.B. in chemistry from Bryn Mawr College. Since 1977 she has been at the Research Center on the Materials of the Artist and Conservator, where she is now an associate staff scientist. Address as for Whitmore.
 Section Index Section Index |