EXPOSURE OF ARTISTS' COLORANTS TO SULFUR DIOXIDEEDWIN L. WILLIAMS, ERIC GROSJEAN, & DANIEL GROSJEAN
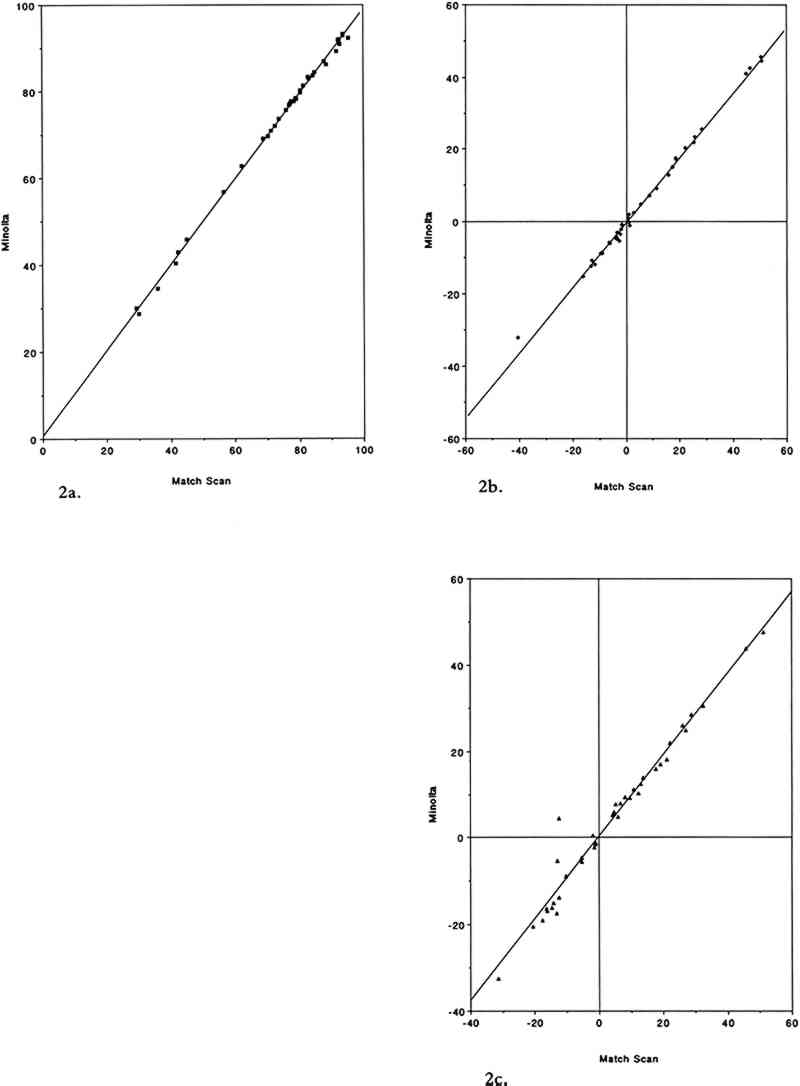
3 RESULTS AND DISCUSSION3.1 COMPARISON OF THE TWO COLOR MEASUREMENT METHODSAs mentioned in the experimental section, color parameters measured using the color analyzer and the spectrophotometer were in good agreement for standard ceramic color tiles and for unexposed colorant samples. This agreement holds true in the case of the colorant samples after exposure to SO2. Linear regression analysis of the color parameters L∗, a∗, and b∗ yielded near unity slopes and high correlation coefficients (table 2). The agreement between the two color measurement methods for SO2-exposed samples is illustrated in figure 2. TABLE 2 LEAST SQUARES LINEAR REGRESSION PARAMETERS FOR COLOR PARAMETERS L∗, a∗, AND b∗ MEASURED ON 40 SULFUR DIOXIDE-EXPOSED COLORANT SAMPLES USING THE COLOR ANALYZER AND THE REFLECTANCE SPECTROPHOTOMETER (a)
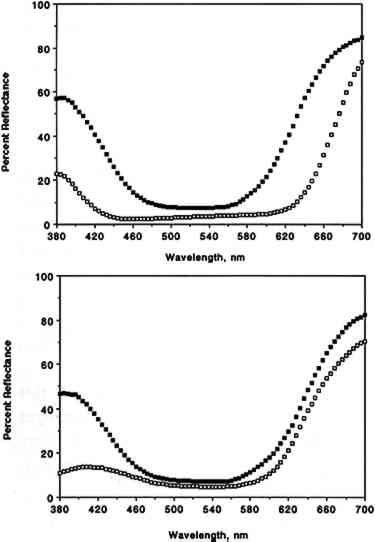
3.2 COLOR CHANGESIn this section, data discussed for colorants apply in fact to colorant “systems” (i.e., the combination of colorant, substrate, mode of application, and other parameters specified in the experimental section). Our results are summarized in table 3, which includes a list of the colorants studied, their origin, their chemical functionality (type of chromophore), the type of substrate employed for sample preparation, and the final color changes (ΔE, calculated from L∗, a∗, b∗ measured with the color analyzer) recorded after 12 weeks of exposure to SO2 in purified air. The corresponding L∗, a∗, b∗, and ΔE values measured after 1, 2, 3, 4, 6, 8, 10, 12, and 14 weeks of exposure are not included due to space limitations. The color parameters x, y, X, Y, Z, L∗, a∗, and b∗ calculated from the full 380–700 nm reflectance spectra recorded with the spectrophotometer are listed in table 4 for unexposed and SO2-exposed colorants. TABLE 3 COLOR CHANGE AFTER 12 WEEKS OF EXPOSURE TO SULFUR DIOXIDE TABLE 4 COLOR PARAMETERS CALCULATED FROM THE 380–700 nm SPECTRA OF UNEXPOSED AND EXPOSED COLORANT SAMPLES For most colorants studied, exposure to 93 � 5 ppb of SO2 for 12 weeks (equivalent to a total SO2 dose of 1,100 ppb/week) resulted in little or no color change. Thus, color changes after 12 weeks of exposure were ΔE ≤1 for 12 colorants, 1 < ΔE ≤2 for 13 colorants, and 2 <Δ E ≤3 for 5 colorants. Within experimental precision, the small color changes measured for those colorants that were not SO2-fugitive (ΔE ≤ 2) were essentially the same (within one standard deviation) as those observed earlier upon exposure for 12 weeks to purified air alone (Williams et al. 1992). Thus for many of these colorants the small color changes observed may in fact be due to air oxidation rather than to reaction with SO2. The most SO2-fugitive colorants (4 < ΔE < 8) included the three triphenylmethane colorants tested, namely basic fuchsin, brilliant green, and pararosaniline base, and possibly one inorganic colorant, chrome yellow (lead chromate). For chrome yellow, the large uncertainty in the measured color change (ΔE = 4.4 � 4.0) reflected nonuniform deposit on Whatman 41 paper, due in part to the limited solubility of the colorant in the coating solvents tested. The reflectance spectra of basic fuchsin and pararosaniline base before and after exposure to SO2 are shown in figure 3. For both colorants, exposure to SO2 results in a substantial change in reflectance in the 380–440 and 600–700 nm regions of the spectrum. For basic fuchsin, the largest change was in
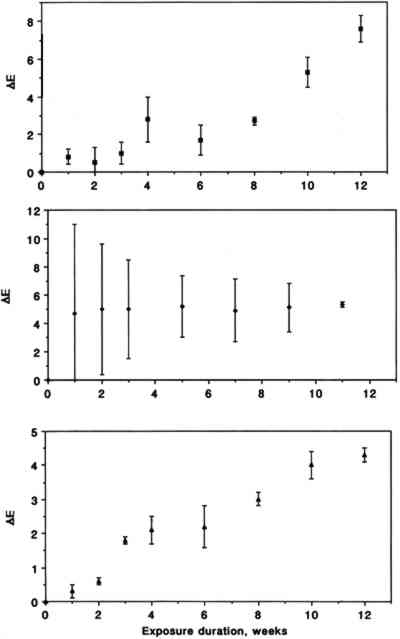
Color changes as a function of exposure duration are shown in figure 4 for the three triphenylmethane colorants. Exposure to SO2 resulted in a gradual fading for pararosaniline base and for basic fuchsin. The trend for brilliant green is less obvious due to substantial scatter of the data in the early part of the experiment. The relative contributions of changes in L∗, a∗, and b∗ to the measured ΔE were 21.6 � 15.3, 40.2 � 31.4, and 38.2 � 46.7%, respectively, for chrome yellow, 8.2 � 0.8, 53.4 � 2.9, and 38.4 � 2.2 % for basic fuchsin, 21.5 � 18.5, 5.0 � 2.1, and 73.6 � 18.2% for brilliant green, and 0.8 � 1.2, 73.1 � 13.0, and 26.1 � 12.3% for pararosaniline base.
3.3 SECOND EXPOSURE TO A HIGHER CONCENTRATION OF SO2After exposure to 93 � 5 ppb SO2 for 12 weeks, the same colorant samples were re-exposed for 2 weeks to a higher concentration A possible explanation for these results is that fading of the colorant-paper system by SO2 is more dependent on the colorant-pollutant contact time (including mass transfer of SO2 and subsequent chemical reaction) than on the SO2 concentration. While no attempt was made to study this effect in a more systematic fashion, our results suggest that a single, short-term test (“accelerated aging”) carried out at high levels of SO2 would have led to a severe underestimate of the actual effect of SO2 on the triphenylmethane colorants tested. TABLE 5 COMPARISON OF COLOR CHANGES IN TWO CONSECUTIVE COLORANT EXPOSURES TO SULFUR DIOXIDE 3.4 COMPARISON WITH OTHER AIR POLLUTANTSAlso of interest in the context of this study is a comparison of color changes resulting from exposure to SO2 to those resulting from exposure to other air pollutants TABLE 6 COMPARISON OF COLOR CHANGE RESULTING FROM EXPOSURE OF COLORANTS ON WATERCOLOR PAPER TO SULFUR DIOXIDE, PEROXYACETYL NITRATE, OZONE, NITROGEN DIOXIDE, FORMALDEHYDE, NITRIC ACID, AND PURIFIED AIR FOR 12 WEEKS The potential for damage to colorants in museum collections is a function of the pollutant concentration, the exposure duration, and the magnitude of the specific pollutant-colorant interaction (i.e., fading or color change). Since the pollutants listed above may be present in museum air at comparable levels, ozone appears to be of greater concern than SO2 with respect to damage to colorant-containing art objects by virtue of its ability to react with a greater diversity of colorant chemical functionalities (unsaturated natural colorants, alizarin derivatives, etc). 3.5 IMPLICATIONS FOR MUSEUM COLLECTIONSOf the several chemical functionalities tested (inorganic colorants, natural organic colorants, and synthetic colorants including arylamides, azo dyes, amino-substituted anthraquinones, and alizarin lakes), only one, the triphenylmethane colorants, was found to be SO2-fugitive under the conditions tested. Since fugitiveness may be closely correlated with colorant chemical functionality, as we have observed in earlier work with ozone (Grosjean et al., 1987, 1988a, 1988b, 1989), this conclusion can probably extended to many other colorants that are structural homologues of those included in this study. Concentrations of SO2 recorded in museum air range from less than 1 ppb (Hisham and Grosjean 1991b) to 40–50 ppb (Hackney 1984; Brimblecombe 1990). In museums that lack heating, ventilation, and air conditioning (HVAC) systems, museums equipped with HVAC without chemical filtration, or museums equipped with HVAC-chemical filtration systems that are not properly serviced, indoor levels of SO2 of about 50 ppb may not be uncommon (especially if outdoor levels of SO2 are high and/or indoor sources of SO2 are present, e.g., space heating). In these museums, it would take only 4–6 months for objects to be exposed to the same dose of SO2 as the one to which artists' colorants were exposed in this study. On the other hand, the airborne SO2 concentration may be as low as 1 ppb in a museum equipped with a well-maintained HVAC-chemical filtration system, located in an urban area where outdoor levels of SO2 are low (Hisham and Grosjean 1991b) and without indoor sources of SO2. In this case, it would take about 15 years for art objects to be subjected to the same dose of SO2 as the one we employed in this study. The limitations of our study with respect to conservation practice are as follows. First, while all but one category of the colorants tested were not SO2-fugitive, objects ACKNOWLEDGEMENTSWe thank Glen R. Cass, California Institute of Technology, Pasadena, California, for permission to use the spectrophotometer. Denise Velez prepared the draft and final versions of the manuscript. |