EXPOSURE OF ARTISTS' COLORANTS TO SULFUR DIOXIDEEDWIN L. WILLIAMS, ERIC GROSJEAN, & DANIEL GROSJEAN
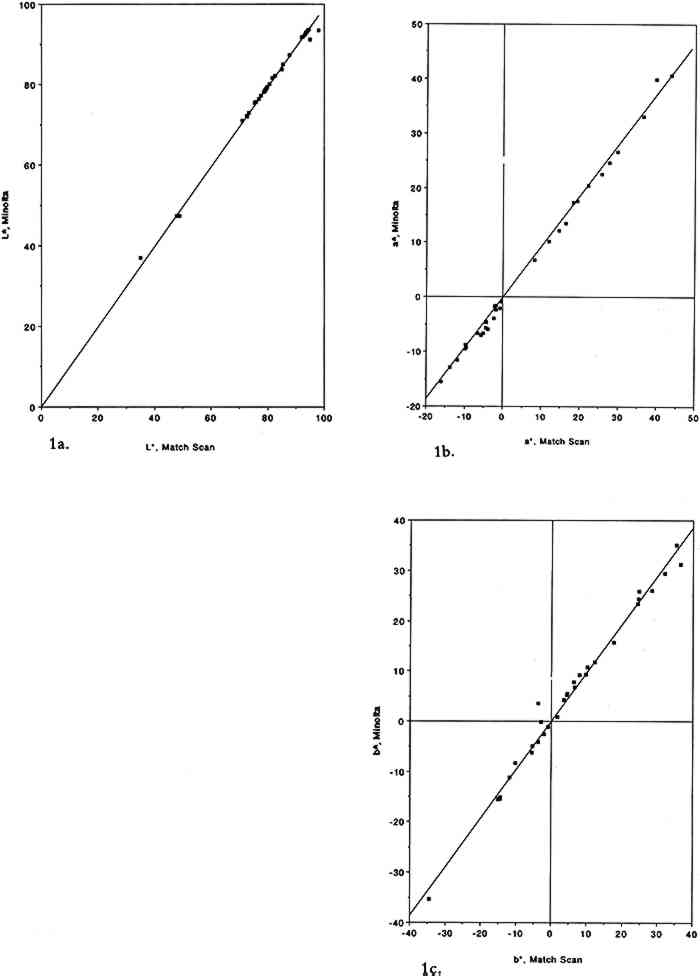
2 EXPERIMENTAL METHODS2.1 EXPOSURE CHAMBERThe colorants were exposed to purified air containing SO2 in a 45 l cube-shaped chamber constructed from six 0.63 cm thick sheets of polymethyl methacrylate. Five sides of the chamber were sealed permanently with acrylic cement, and the sixth (top) panel could be removed for periodic removal of colorant samples. A 2.9 cm wide collar coated with high-vacuum Teflon grease provided a leak-free seal between top and side panels. To minimize wall losses, the chamber was lined inside with clear Teflon film. Two small ports, inlet and exit, were located on opposite sides of the chamber. Additional details regarding the exposure chamber can be found elsewhere (Williams and Grosjean 1992). 2.2 EXPOSURE PROTOCOLPurified air was obtained by passing ambient air through large beds of activated carbon, silica gel, and Purafil (permanganate-coated alumina). These sorbent beds were followed by a glass fiber filter, which removed particulate matter, if any, downstream of the sorbent beds. The purified air thus obtained contained no detectable amounts of ozone, oxides of nitrogen, nitric acid, organic acids (formic and acetic acids), hydrogen sulfide, formaldehyde (0.46 � 0.42 ppb), acetaldehyde (0.97 � 0.79 ppb), or PAN (0.2 ppb). The concentration of SO2 in the purified air was less than our detection limit of 2.0 ppb. Two consecutive colorant exposures were carried out, one to 93 � 5 ppb SO2 for 12 weeks and the other to 920 � 30 ppb SO2 for 2 weeks. The exposures were carried out in the dark (chamber covered with sheets of opaque plastic) at room temperature Sulfur dioxide was measured by pulsed fluorescence using a continuous analyzer calibrated using a certified SO2 permeation tube according to U.S. Environmental Protection Agency-recommended calibration procedures. The instrument was connected to the matrix air lines upstream and downstream of the test chamber using Teflon tubing and three-way switch valves. The concentration of SO2 was generally monitored at the test chamber exit. Frequent checks were also made of the inlet concentration to verify the stability of the output of the SO2 permeation tube. With the exposure protocol described above, the concentrations of SO2 to which the colorants were exposed were reasonably constant. Weekly averaged SO2 concentrations are listed in table 1 along with the corresponding cumulative averages. Also listed in table 1 are the cumulative doses of SO2 to which the colorants were exposed (dose = product of SO2 concentration and exposure duration, units = ppb/week). Comparison of the test chamber inlet and exit SO2 concentrations indicated that on the average 32% of the inlet SO2 was removed by the colorant samples and the associated hardware. The empty chamber lined with Teflon film removed 12% of the inlet SO2 concentration. TABLE 1 SULFUR DIOXIDE CONCENTRATIONS AND DOSE OF SULFUR DIOXIDE TO WHICH THE ARTISTS' COLORANTS WERE EXPOSED To obtain an independent measure of the amount of SO2 to which the colorant samples were exposed, carbonate-coated filters housed in passive samplers (Hisham and Grosjean 1991b) were placed weekly in the test chamber and were analyzed for their SO2 content (as sulfate ion) by liquid chromatography with ultraviolet detection (Williams and Grosjean 1992). Three passive samplers were included each week during the first 5 weeks of the test. The 5-week-averaged SO2 concentration was 40 � 16 ppb, in reasonable agreement with the value of 51 � 20 ppb measured at the test chamber exit (see table 1). Sample exposure to SO2 was interrupted for about 2.5 hours at the end of the first week, second week, and so on, for color change readings. The cumulative duration of color change readings was 20 hours, or 1% of the total exposure duration, during which the samples were exposed to indoor light and to indoor laboratory air containing only low levels of air pollutants and levels of SO2, if any, that were below detection (≤ 2 ppb). Thus, these interruptions had little impact, if any, on the measured color changes. 2.3 COLORANTS AND SAMPLE PREPARATIONThe colorants studied including natural organic compounds (e.g., gamboge), modern organic colorants (including a number of Winsor and Newton watercolors), and inorganic pigments (e.g., Prussian blue, chrome yellow). These colorants were selected for consistency with those already studied for their fugitiveness to ozone, nitrogen dioxide, nitric acid, PAN, and formaldehyde. Most colorant samples were prepared by airbrushing dilute suspensions onto sheets of watercolor paper. To investigate possible substrate-specific effects, a few colorant samples were coated on Whatman 41 cellulose paper. The amount of colorant applied to watercolor paper was adjusted to obtain an initial reflectance of about 40% at the minimum reflectance wavelength. The colorant samples thus prepared were exposed to SO2 as 25 � 25 mm squares (watercolor paper) or 25 mm diameter discs (Whatman 41 paper). 2.4 COLOR MEASUREMENTSColor changes were measured by reflectance spectroscopy using two instruments, a Minolta color analyzer and a Bausch and Lomb reflectance spectrophotometer. The color analyzer was calibrated using a white reflector plate standard, and the light source standard was CIE illuminant C (CIE 1931 standard observer). The color analyzer's sample viewing area is 3 mm diameter. Additional calibration checks were carried out using a set of 12 standard ceramic color tiles (4 neutral grays and 8 chromatic standards) developed by the British Ceramic Research Association, Ltd., and calibrated at the National Physical Laboratory. The reflectance spectrophotometer was calibrated using a standard white tile referenced to an NBS standard. The spot size of the light beam was limited to 7 mm diameter using the small area view option. Calibration and reflectance spectra were all recorded with the specular beam excluded. Reflectance measurements were made at 2 nm intervals from 380 nm to 700 nm. Additional details regarding the measurement protocol have been previously reported (Whitmore et al. 1987; Whitmore and Cass 1989). Color changes can be reported using several color parameter systems including Using the color analyzer, the parameters L∗, a∗, b∗, and ΔE were measured after 1, 2, 3, 4, 6, 8, 10, 12, and 14 weeks of exposure. Using the spectrophotometer, the color parameters x, y, X, Y, Z, L∗, a∗, and b∗ were calculated from the reflectance spectra of the unexposed colorants and those of the same colorants after 14 weeks of exposure to SO2. Other color parameters could be readily calculated if so desired from these chromaticity coordinates and from the corresponding reflectance spectra. The reflectance spectra (plots and computer printouts) and color analyzer L∗ a∗ b∗ readings made after 1, 2, 3, etc., weeks of exposure (computerized spreadsheets) are not included in this article due to space limitations. 2.5 PRECISION AND ACCURACY OF COLOR MEASUREMENTSFor the ceramic standard tiles, the relative standard deviation (RSD, the standard deviation divided by the mean value) was 0–0.7% (L∗), 0–12.4% (a∗), and 0–22% (b∗) for triplicate measurements on all tiles using the color analyzer. The RSD was less than 2% except when the chromaticity parameters a∗ and/or b∗ were <1. For six sets of measurements on two tiles (red and cyan) with the spectrophotometer, the RSD was 0.1–0.6% (L∗), 0.7–0.9% (a∗), and 0.3–2.5% (b∗). For the colorant samples, the spectrophotometer's RSD for eight sets of replicates was 0–1.25% (L∗), 0.1–2.9% (a∗), and 0.1–3.3% (b∗). The color analyzer's RSD (sets of triplicate samples for all colorants studied) was typically 1–3% (see section 3 below). For the color analyzer, multiple measurements on single samples were all within 0.2 ΔE units for measurements carried out on the same day and were within 5–10% of the mean ΔE value for measurements carried out up to six months apart. Color parameters measured using the color analyzer and the spectrophotometer have been shown to be in good agreement for standard ceramic tiles. Linear regression analysis of the color parameters x, y, Y, L∗, a∗, and b∗ measured with the color analyzer and with the spectrophotometer versus the corresponding nominal values for the standard ceramic tiles yielded near-unity slopes and correlation coefficients >0.95 (Williams et al. 1991, 1992). The nominal values are those specified by the manufacturer for a “Master Set” of standard tiles. The good agreement between nominal and measured As is shown in figure 1, linear regression of the same color parameters for a set of 30 colorant samples (e.g., L∗, color analyzer versus L∗, spectrophotometer) also yielded near unity slopes and correlation coefficients of >0.99.
|