THE HISTORY AND SIGNIFICANCE OF THE SCHREGER PATTERN IN PROBOSCIDEAN IVORY CHARACTERIZATIONEDGARD O'NIEL ESPINOZA, & MARY-JACQUE MANN
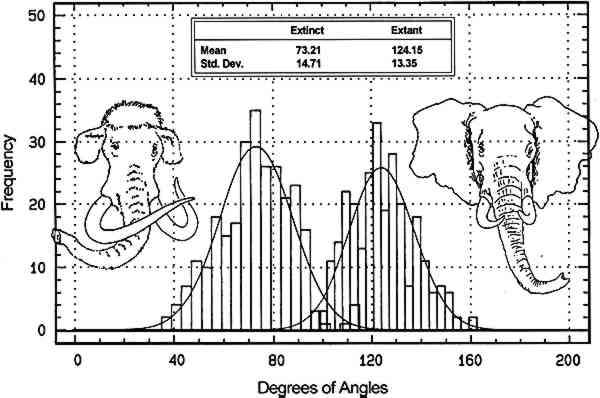
5 OBSERVATIONS AND DISCUSSIONWe obtained intertusk Schreger angle data from the outside pattern area to document angle variance within and along a single tusk. Five convex and five concave outside angle measurements were obtained from each of 16 sequential sections taken from a Loxodonta africana tusk approximately 90 cm x 12.5 cm. Pooled convex angle and concave angle measurements from tusk sections ranged between 134.5� and 143� (average = 139.1�, standard deviation = 2.37) with no significant variance observed from section to section. Sectional convex and concave angle data were then converted to radians for statistical purposes and compared to each other by t-test statistic with p<0.05 considered significant. The t-test statistic tests the hypothesis (HO) that there is no difference between the convex and concave angle data, where p<0.05 represents the smallest value that would lead to rejection of the hypothesis. No significant difference was observed between the convex and concave Schreger angles within the outside area of a tusk. Five convex and five concave outside Schreger angle measurements were taken from each Loxodonta and Elephas (n = 26), and from each Mammuthus primigenius (n = 26) tusk sample. For elephant the combined average was 124.2� (standard deviation = 9.28) with a range from 95� to 163�; for mammoth the average was 73.7� (standard deviation = 9.76) with a range from 35� to 115�. Radian-transformed convex and concave angle data from each tusk sample were compared by t-test statistic, with p<0.05 considered significant. No significant statistical difference was observed between convex and concave Schreger angles within individual samples. Since no differences were observed, the data from each tusk sample were averaged to get a single value to represent each individual. Radian-transformed mean data from each of the 26 elephants and 26 mammoth samples were compared by t-test statistic with p<0.05 considered significant. The t-test statistic tests the hypothesis (HO) that there is no difference between the angle data from extinct and modern samples, where p<0.05 represents the smallest value (t.95 = � 1.671) that would reject the hypothesis. The statistical analysis rejected the TABLE 1 DISTRIBUTION IN RADIANS AND DEGREES OF MAMMUTHUS PRIMIGENIUS AND LOXODONTA/ELEPHAS SCHREGER PATTERN ANGLE MEANS
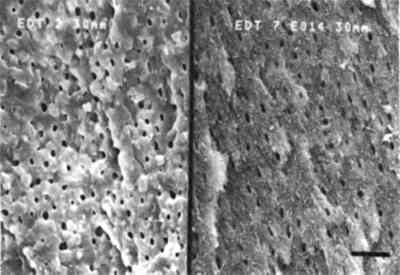
Schreger Pattern outer angles in proboscidean ivories clearly differentiate between extinct (legal) and modern (illegal) sources, and micromorphology is the basis for these angle expression differences. The Schreger Pattern is a shadow phenomenon created primarily by the structure of microscopic dentinal tubules (Miller 1890; Miles and White 1960; Miles and Boyde 1961); the contribution of laminar dentine deposition to the Schreger Pattern is suggested but not fully understood. Dentinal tubules are fluid transport microcanals that radiate medially to laterally in rows from the center of the tusk, like the spokes of a wheel. Tubule diameter ranges from approximately 0.8 μm to 2.2 μm, and proboscidean dentinal tubules are sinusoidal. Both mammoth and modern elephant dentinal tubules have peak to peak sinusoidal wave distances of 0.8 to 2.5 mm. The visual perception of the Schreger Pattern is a function of intertubule distances and the wave alternation of adjacent dentinal tubule rows. Scanning electron microscopic examinations of Loxodonta, Elephas, and Mammuthus ivories revealed differences in tubule density. Tusks with effectively equal macromorphology have more dentinal tubules per unit area in mammoths than in modern elephants (fig. 3).
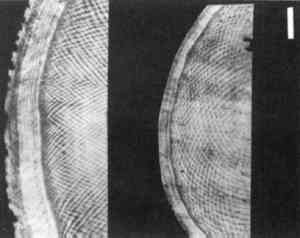
The effect of greater tubule density creates shadow lines that form small (acute) Schreger angle patterns such as those seen in mammoth ivory. Fewer tubules per unit area, as observed in Loxodonta and Elephas ivories, result in greater distance between shadows and therefore greater (obtuse) angles (fig. 4).
The Schreger Pattern is a unique and reliable identifier of proboscidean ivory. Statistical analysis and microscopic observations show that the Schreger Pattern can also serve to nondestructively and objectively differentiate between elephant and mammoth ivories. ACKNOWLEDGEMENTSThe authors thank Larry Agenbroad, William Gould, Clayton Ray, and Richard Tedford for contributing mammoth ivory standards used in this study. We also thank Bernhard Binder, Evelyn Burchett, and Susan Taylor and for translations of the Schreger and Obermayer papers, and Stephen D. Busack for critical review of this manuscript. |


