PROTECTION OF ARCHIVAL MATERIALS FROM POLLUTANTS: DIFFUSION OF SULFUR DIOXIDE THROUGH BOXBOARDCHARLES M. GUTTMAN, & KENNETH L. JEWETT
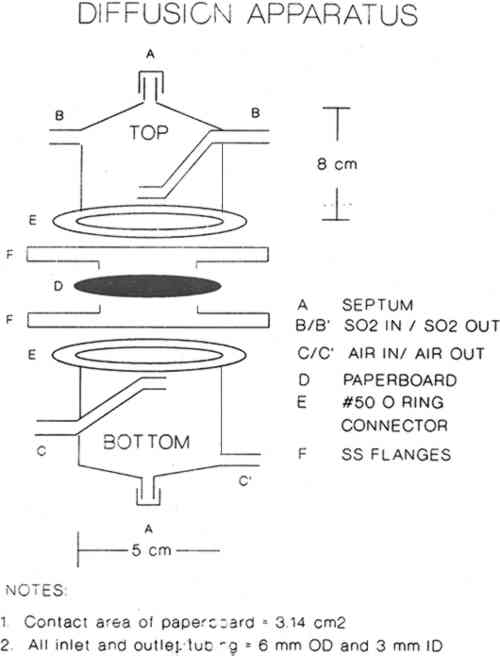
ABSTRACT—The diffusion of sulfur dioxide, a common atmospheric pollutant, through boxboards used to make up archival storage boxes has been measured, and diffusion constants were calculated from the resulting data. For the most common boxes used by the National Archives and Records Administration, a diffusion constant of about 0.001 cm2/sec is measured for SO2 in the concentration range 10–150 ppm. For this 15-fold change in gas concentration, less than 25% variation in the calculated diffusion constant was found. These results are discussed in terms of Passaglia's model of the microenvironment provided by these boxboards as used in archival storage. 1 INTRODUCTIONArchives, libraries, and museums provide long-term storage of enormous volumes of records. Protecting these documents from degradation is a matter of great concern. Because the temperature and the condition of the atmosphere in storage areas such as library stacks are important in mediating the rate of degradation of the stored records, these parameters are controlled. However, atmospheric pollutants such as particulate matter, various oxides of nitrogen, sulfur dioxide (SO2), and ozone cause degradation of records (Baer and Banks 1985). In some cases the removal of air pollutants from the external air by the air conditioning system is inefficient (Hughes and Myers 1983). In the stacks, many records are often stored in containers and not exposed directly to the stacks environment. These records experience a microenvironment that may be different from the macroenvironment of the stacks. If this microenvironment in fact is, or could be made to be, less aggressive, then expensive changes in the air conditioning system might be obviated. Recently, Passaglia (1987) studied this microenvironment with specific reference to storage in the National Archives and Records Administration (NARA). He suggested that a study of the protection mechanism provided by the container, in particular the cardboard boxes used to safeguard a large quantity of archival material, would be valuable. Passaglia presented models and calculations to estimate the effectiveness of various containers for protection of archival materials from environmental pollutants. However to utilize these models, values of the diffusion constant through boxboard are needed. In this article we report the diffusion constant of SO2 through various boxboard materials commonly used to fabricate storage boxes. The concentration range of SO2 used in these experiments was 10–150 ppm of SO2 in air. Using these measurements along with Passaglia's model, we are able to estimate the effectiveness of the archival boxes in providing a microenvironment that is different 2 EXPERIMENTAL2.1 CHEMICALS AND MATERIALSCylinders of 10–500 ppm concentrations of SO2 in air were obtained from commercial sources and used as received. Calibrations and diffusion experiments were performed using those cylinders. Calibrations were also performed using SO2 gas permeation tubes. Concentrations of SO2 were accurately delivered into the sulfur-specific detector by controlling the gas flow through the permeation tubes with previously calibrated mass flow controllers. Boxboard samples were obtained from NARA and Conservation Resources International. Table 1 describes these boxboards. TABLE 1 2.2 APPARATUSDiffusion measurements were performed using the apparatus shown in figure 1. SO2 at a concentration of Ci in air was passed through the top compartment while air was passed through the bottom compartment. Both gases were prehumidified by passing them through water solutions slightly acidified with sulfuric acid and maintained at 10.5 �C. Thus these gases contained relative humidities of 54% � 5% at the measurement temperature of 20�1�C.
Sierra Instruments Model 840 flow controllers were used to control flow rates in the diffusion experiments and also to deliver accurately the desired gas flow rates when performing calibrations using SO2 gas permeation tubes. For the diffusion experiments the flow rates were varied from 25 ml/min to 100 ml/min. Sulfur dioxide concentrations were measured using a Hewlett Packard Model 5730A gas chromatograph with a sulfur-selective flame photometric detector (GC–FPD). A Supelco Chromosil 330 (⅛ in � 8 ft Teflon) column was used to verify that there were no other sulfur-containing gases present. Quantitative measurements were then made with a short length of ⅛ in diameter Teflon tubing containing no packing material. This absence of packing material ensured far greater measurement precision. When the apparatus was clamped as shown in figure 1, the unsealed boundary condition (see section 3.2) was obtained. The sealed boundary condition was obtained by additionally placing a bead of GE Clear RTV Silicone Rubber Adhesive Sealant around the circumference of the paperboard (D) seal with the stainless steel flange (F). Then all the paperboard extending beyond the lip of the flange was covered with an additional 8 mm of the sealant. The sealant was allowed to cure while gas flowed on both sides of the sample. On curing, the sealant gives off acetic acid. High concentrations of acetic acid did not affect the magnitude of the sulfur dioxide signal in the GC-FPD. 3 THE MEASUREMENT OF DIFFUSION CONSTANT3.1 DESIGN OF APPARATUS AND CALCULATION OF DIFFUSION CONSTANTDiffusion measurements were made following the general design used in obtaining diffusion constants for gases in porous media (Smith 1981). In these experiments a feed gas containing a fixed concentration of pollutants in air was passed on one side of the boxboard. On the other side of the sample, air (no pollutants) at the same RH was passed as a sweep gas. The concentration of pollutant in each chamber was measured, and these concentrations were used with the flow rate and sample geometry to calculate the diffusion constant. Figure 1 shows the design of the diffusion cell. The following section indicates how the diffusion constant may be determined. The flow of the pollutant across the paper (Smith 1981; Barrer 1941; Crank and Park 1968) is:
This treatment neglects the possibility of SO2 dissolution by the boxboard, and if this occurs in our samples, we may be measuring permeability constants rather than diffusion constants. No suitable treatment was found in the literature to describe diffusion of a pollutant through a porous medium where the pollutant dissolves in the medium. However, since the change of concentration of SO2 in the stacks surrounding archival boxes is expected to be slow (Baer and Banks 1985; Passaglia 1987), our calculated diffusion constant should be a good measure of mass flow of pollutants into archival boxes. For the rest of this article we shall assume the calculated quantity is a diffusion constant. Sulfur dioxide diffused through boxboards G, H, and J so slowly that a diffusion constant could not be determined in our apparatus. However, the smallest concentration that could be determined may be estimated by using the GC-FPD calibration curve for SO2. For SO2 at 147 ppm in air, this concentration gives a value of 0.0025 for Co/(Ci-Co) in equation 3. For a value of qo of 10 ml/min using a 60-point boxboard, the smallest diffusion constant that can be determined by our measurement procedure is 2 � 10-5 cm2/sec. Therefore, the diffusion constants of boxboards G, H, and J must be less than that value. Since SO2 is absorbed by paper (Hudson et al. 1964; Edwards et al. 1968; Atherton et al. 1973), one might be concerned that no SO2 was observed diffusing through boxboards G, H, and J due to the massive absorption of SO2. Concentration of the gas before it impinged on the boxboard (CB) was routinely measured. This measurement was made to check the calibration on the GC-FPD and the mass balance in the system. During the measurement, the concentration of pollutant leaving the top chamber was not significantly different from CB for all the boxboards measured. If significant absorption of SO2 had occurred in boxboards G, H, and J, a large concentration drop would have been expected. Such a concentration drop was not found. 3.2 EFFECT OF BOUNDARY CONDITION ON THE VALUE OF THE DIFFUSION CONSTANTDiffusion constants are obtained from experiments by assuming the measurements have been made on a sheet of infinite dimensions. Experimentally, that condition cannot be obtained. When diffusion through a finite area is measured, diffusion through the edges must be considered. In a boundary condition used in many diffusion experiments, the edges of the apparatus are sealed, thereby eliminating flow in that direction (Crank 1975; Barrer et al. 1962). Barrer et al. (1962) discussed the error made by this boundary condition. For this current work, several measurements under this condition were performed. Under our experimental conditions, Barrer's modeling suggests that using this boundary condition leads to a diffusion constant that is no more than 8% larger than the diffusion constant obtained for the infinite sheet case. Measuring the diffusion constants in an apparatus that allows the sides of the boxboard to remain open is another boundary condition. Under this condition, mass may be lost through the edge, thereby reducing the concentration in the bottom compartment. For this case, the measured diffusion constant is lower than that for the infinite sheet case. The true (infinite sheet) diffusion constant lies between those found under these two boundary conditions. In table 2, diffusion constants obtained for various boxboards at 147 ppm SO2 in air are listed for these boundary conditions. These data indicate that the effect of boundary conditions on our measurement is generally less than 20%. TABLE 2 EFFECT OF APPARATUS BOUNDARY CONDITION ON MEASURED DIFFUSION CONSTANT 3.3 ACHIEVEMENT OF STEADY STATE CONDITIONAll diffusion constants were obtained after steady state had been reached, so that the effects of SO2 absorption in the boards could be minimized (Crank and Park 1968). Normally, the experiment was started approximately 24 hours before data collection was initiated. Points were then taken regularly two or three times daily. Steady state was assumed when the value of the diffusion constant showed no drift with time. Errors in the calculated average value of the diffusion constant were estimated from the standard deviations of repeated data taken for a number of hours after steady state had been achieved. These are reported in tables 2–4. On boxboard A, measurements were made on three samples cut from different parts of the NARA box. In this case, errors estimated from the sample to sample variation in D were comparable to the errors estimated from the measurements on one board. TABLE 3 EFFECTS OF GAS CONCENTRATION DIFFUSION CONSTANT (a) TABLE 4 DIFFUSION CONSTANT OF VARIOUS BOXBOARDS AT 147 PPM SO2 IN AIR 4 RESULTS AND DISCUSSION4.1 EFFECT OF SO2 CONCENTRATION ON DIFFUSION CONSTANTThe diffusion constants for two types of NARA boxboards at different SO2 concentrations are summarized in table 3. Data from sample A and sample B suggest that there are only small differences in the diffusion These results suggest that the limiting low-concentration diffusion constant of SO2 in these boxboards may be close to the values of the diffusion constant we have measured. Thus, these data and previously mentioned observations tend to provide confidence in our experimental approach to this study. 4.2 EFFECT OF COMPOSITE NATURE OF BOXBOARD ON DIFFUSION CONSTANTMany of the boxboards used to make boxes for archival storage are composite boards made of thinner boards glued together. This section is a discussion of the effects of the construction of the boxboard on the flow of SO2 through the boxboard. Two extreme cases may be considered. In one case, the glue adheres to the boxboard matrix without filling the pores and impeding diffusion. In the other case, the glue creates a well-defined, intact polymer film with no holes between the two paperboards. In the first case, SO2 flux through the boxboard is not affected by the presence of the glue. In the latter case, the glue may completely control the flux. In this study we have measured the diffusion across some boxboards that are composites made from other boxboard materials we have also studied. One such material, sample H, is a composite board manufactured by gluing three layers of sample F together. If the glue layer has no effect on the permeation properties, then the diffusion constant of samples H and F should be identical. Inspection of table 4 shows they are very different. By using information from the manufacturer of the board along with The manufacturer of the boxboard claims that there is about 4.5 kg of dry adhesive deposited per 280 square meters of boxboard laminated. Assuming the density of the dry adhesive is one g/cc, we estimate a total thickness of adhesive of 0.0016 cm for the two glue films between the three pieces of boxboard. For a composite board, the diffusion constants may be estimated from the diffusion constant of its components as (Crank 1975):
When equation 8 is solved, the diffusion constant for the composite board, sample H, is estimated to be 1.0 � 10-6. This value is within our estimated bound for the diffusion constant of sample H given in table 4. The reader should note the dominance of the first term on the right-hand side of equation 8. This indicates that pollutant diffusion through the composite board is limited by the diffusion through the adhesive layer. Even an order of magnitude decrease in the boxboard diffusion constant would not change the observation that the adhesive layers control the flow through the composite boxboard. If the glue film is not intact, however, the value of lf/Df could decrease by many orders of magnitude. This loss of total coverage by a film could arise in the original application and drying of the film or could result from the aging of the film. This variation in film coverage may explain why some composite boards have relatively high diffusion constants (samples A, B, and C), and some have very low diffusion constants (samples G, H, and J). Thus we believe the properties of the glue used in the manufacturer of the boxboard should be considered when estimating the overall flux of pollutants through a boxboard whose diffusion constant has not been directly measured. 4.3 COMPARISON TO EARLIER DATA
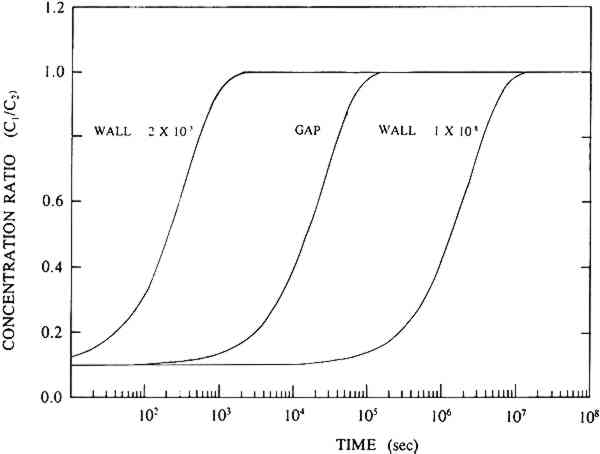
Dimitroff and Lacksonen (1986) reported a value of 0.007 cm2/sec for the diffusion of sulfur dioxide in air through stacked layers of rag paper. Their value of diffusion constant is higher than any value of diffusion constant obtained on boxboard in our study. There may be a variety of reasons for this difference. First, Dimitroff and Lacksonen studied paper. The structure of the paper may be different enough from that of the boxboard to cause a difference in the diffusion constant. Second, Dimitroff and Lacksonen made their measurement on a stack of paper. Between each sheet is an air space through which SO2 diffuses faster than it does in paper. Thus, their measured value of diffusion constant of SO2 in rag paper may be higher than the true value. Finally, Dimitroff and Lacksonen measured the diffusion constant by sealing the edges of their paper. This boundary condition led them to measure flows through the paper that would be higher than would be measured in an infinite sheet. Barrer et al. (1962) modeled the diffusion constant measurement in a sealed system and showed the errors made by this measurement compared to the infinite sheet measurement (see our discussion in section 3.2). They show that the error in the measurement is strongly dependent on the ratio of the thickness of the sample to the radius of the cross-sectional area through which the gas is passing. As this ratio increases, the error increases. Our analyses of the Dimitroff and Lacksonen measurement system suggest that this ratio is about 0.4 for their measurements. In that case, the Barrer et al. (1962) study suggests the measured flow would be too high by at least 40% and would result in a high apparent diffusion constant. 4.4 COMPARISON OF EFFECTS OF DIFFUSION THROUGH THE WALLS OF BOX MATERIALS TO DIFFUSION THROUGH GAPSPassaglia (1987) studied the microenvironment provided by a prototype archival box in protecting its contents from atmospheric pollutants. He presented a variety of models including: (1) a model that describes the protection provided by boxes that act as barriers to pollutants due to diffusion alone, and (2) a model in which the boxboard acts as a barrier both by reacting with the pollutant and slowing the flow of the pollutant through the boxboard. His models included calculations for prototype boxes filled with paper reactive with the pollutant and boxes that were empty. In all these models of the prototype box, he found that the pollutant flow into the box was affected by the flow through the gaps in the box arising from the construction of the boxes as well as the diffusive flow through the boxboard itself. His model separated out the contribution of the pollutant flow through gaps in the boxes as compared to the pollutant flow by diffusion through the boxboard itself. Passaglia's models show a range of protection time scales. In the models that do not allow for reaction of the pollutant with the box material, he found that the time of protection is about a week. From the point of view of archival storage, the box allows for buffering of the materials in it only from short time variations in the pollution concentration. In the models in which he allowed for reaction with the boxboard and the paper filling the box, he found that the box may protect the contents for about a year. This time scale approaches archival storage time periods. All Passaglia's (1987) models require an estimate of the diffusion constant through boxboard as well as other reaction constants of the pollutant with paper or boxboard. At the time, he had no direct estimate of the diffusion constant of SO2 through paper. He estimated the diffusion constant of pollutants through boxboard as 10-8 cm2/sec. With this value of the diffusion constant, in all his models he concluded that the mass flow of pollutant brought about by diffusion through gaps is much higher than the mass flow from diffusion through the boxboard itself. This conclusion suggests that closing the gaps will improve control of the microenvironment for any of those models. From the measurements provided in this study, we find diffusion constants ranging from 10-3 to 10-6 cm2/sec for the various measured boxboards. As an example of how this change in number can affect the conclusions to Passaglia (1987), the calculation for one of Passaglia's models was performed. In this model Passaglia considered the flow change due to diffusion alone. This model included no modeling of the reaction of the pollutant with boxboard. We employed this model because: (1) our work is mainly concerned with the diffusion constant alone, and (2) the effects of changing the diffusion constant on the other models follow a pattern similar to that found for this model. In this model, the SO2 in the area outside the box is held constant at concentration C2. We consider a box that allows SO2 into the box due to diffusion through the boxboard and diffusion through the gaps. No reaction with the walls is considered. The box is considered to be empty. For this model, following Passaglia's equation 7, the ratio of the concentration on the inside of the container, C1, to the concentration of pollutant outside the container, C2, for flow through either gaps or through the boxboard is given by
TABLE 5 PARAMETERS USED TO MODEL PROTOTYPICAL EMPTY CONTAINER With the value of the diffusion constant for boxboard in the range of the NARA boxboard value, we find that mass flow due to diffusion through the boxboard walls of the box is faster than the mass flow through the gaps. Thus, the use of boxes without gaps is of no importance for boxes made of these boards. However, for the boxboards 5 CONCLUSIONSThe diffusion constant of the common atmospheric pollutant, SO2, in the boxboards used to make up some archival boxes was determined to be 0.004 cm2/sec or less for gas concentrations of 10–150 ppm. Although these gas concentrations are much higher than those found normally in the atmosphere, these data show the order of magnitude of diffusion though these boxboards. Further, the glue layer used to make up this composite boxboard may have a significant effect on the diffusion in some boxboards. When values for the diffusion constant of NARA boxboards are put into the Passaglia models, we find that the pollutant flow into a prototypical archival box is controlled by the diffusion through the boxboard. ACKNOWLEDGEMENTSSupport for this project came from a grant from the National Archives and Records Administration (NARA), Washington, D.C. The authors would also like to thank W. Contribution of the National Institute of Standards and Technology. Not subject of copyright. REFERENCESAtherton, J. B., F. LythHudson, and J. A.Hockey. 1973. The effect of temperature, light, and some transitional metal ions of the sorption of sulphur dioxide by paper. Journal of Applied Chemical Biotechnology23:407–14. Baer, N. S., and P. N.Banks. 1985. Indoor air pollution: Effects on cultural and historic materials.International Journal of Museum Management and Curatorship4:9–20. Barrer, R. M.1941. Diffusion in and through solids. London: Cambridge University Press. Barrer, R. M., J. A.Barrie, and M. G.Rogers. 1962. Permeation through a membrane with mixed boundary conditions. Transactions of the Faraday Society58:2473–83. Brandrup, J., and E. H.Immergut. 1989. Polymer handbook, 3d ed.New York: John Wiley and Sons. Crank, J.1975. The mathematics of diffusion, 2d ed.Oxford: Clarendon Press. Crank, J., and G. S.Park. 1968. Diffusion in polymer. London: Academic Press. Dimitroff, M. A., and J. W.Lacksonen. 1986. The diffusion of sulfur dioxide in air through stacked layers of paper. Journal of the American Institute for Conservation25:31–37. Edwards, C. J., F. LythHudson, and J. A.Hockey. 1968. Sorption of sulphur dioxide by paper. Journal of Applied Chemistry18:146–48. Hudson, F. L., R. L.Grant, and J. A.Hockey. 1964. The pick-up of sulphur dioxide by paper. Journal of Applied Chemistry14:444–47. Hughes, E. E., and R.Myers. 1983. Measurement of the concentration on sulfur dioxide, nitrogen oxides, and ozone in the National Archives Building. NBSIR 83-2767, Gaithersburg, Md.: National Bureau of Standards. Available from the National Technical Information Service. Passaglia, E.1987. The characterization of microenvironments of archival records: A research program, 1987. NBSIR 87-3635. Gaithersburg, Md.: National Bureau of Standards. Available from the National Technical Information Service. Smith, J. M.1981. Chemical engineering kinetics, 3d ed.New York: McGraw Hill. SOURCES OF MATERIALSCertain suppliers of chemicals and equipment are identified by name in order to specify the experimental conditions adequately. This does not imply endorsement or recommendation by the National Institute of Standards and Technology, nor does it imply that the particular brands of chemicals and equipment named are necessarily the best for the purpose.AUTHOR INFORMATIONCHARLES M. GUTTMAN obtained his Ph.D. in physical chemistry from Brandeis University. Guttman is a fellow of the American Physical Society and a member of the American Chemical Society. He is actively involved with the American Society for Testing and Materials committees D20 on plastics and E37 on thermal analysis. He is also the alternate NIST representative for the ANSI committee IT9–1. He is a research chemist in the Polymers Division of the National Institute of Standards and Technology, where his research focuses on the diffusion of KENNETH L. JEWETT obtained his Ph.D. from the University of Maryland at College Park in 1978 where he majored in inorganic chemistry while having a minor concentration in physical chemistry. He is a research chemist in the Polymers Division of the National Institute of Standards and Technology. During his career, he has focused on the study of metal and organometallic reactions, the developemnt of ultrasensitive techniques to speciate and quantitate trace levels of analytes, and the study of reaction rates and equilibria of species in selected environments. He has 28 publications to his credit involving research in those areas. Address: Polymers Division, National Institute of Standards and Technology, United States Department of Commerce, Gaithersburg, MD 20899.
 Section Index Section Index |