EXPOSURE OF ARTISTS' COLORANTS TO PEROXYACETYL NITRATEEDWIN L. WILLIAMS, ERIC GROSJEAN, & DANIEL GROSJEAN
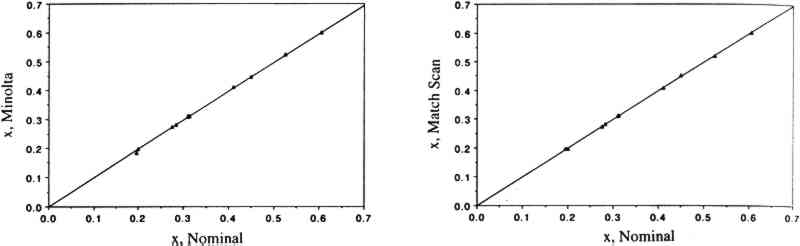
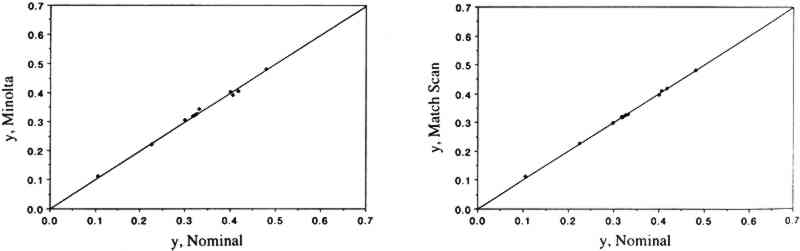
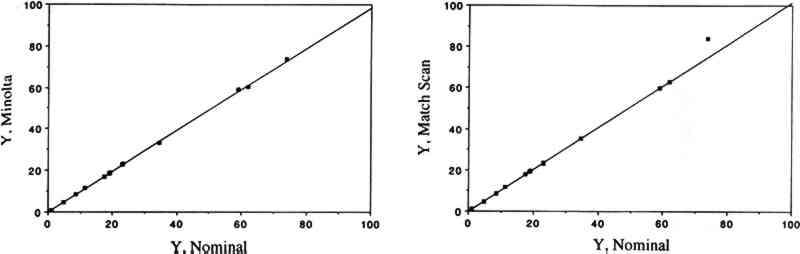
3 RESULTS AND DISCUSSION3.1 COMPARISON OF THE TWO COLOR MEASUREMENT METHODSColor parameters measured using the color analyzer and the spectrophotometer were shown to be in good agreement for both standard ceramic tiles and for a set of 30 colorant samples. Linear regression analysis of the color parameters x, y, Y, L∗, a∗, and b∗ measured with the color analyzer and with the spectrophotometer vs. the corresponding nominal values for the standard ceramic tiles yielded near-unity slopes and correlation coefficients > 0.95. These linear relationships are shown for the color parameters x (fig. 1), y (fig. 2), and Y (fig. 3). The nominal values are those specified by the manufacturer for a “master set” of standard tiles. The good agreement between nominal and measured values indicate good accuracy for both instruments. Linear regression of the same color parameters for a set of 30 colorant samples (e.g., L∗, color analyzer vs. L∗, spectrophotometer) also yielded near-unity slopes and correlation coefficients of > 0.99 (Williams et al. 1992).
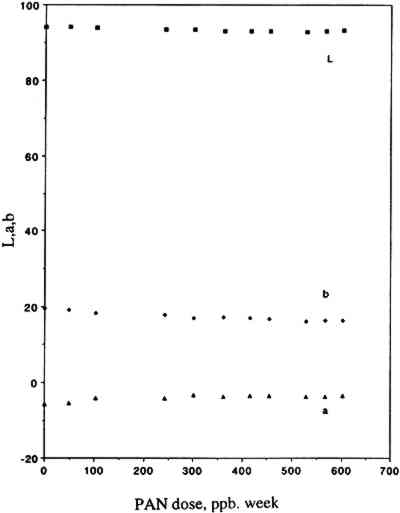
3.2 COLOR CHANGESOur results are summarized in table 2, which includes a list of the colorants studied, their origin, their chemical functionality (type of chromophore), the type of substrate employed for sample preparation, and the final color changes (ΔE, calculated from L∗, a∗, b∗ measured with the color analyzer) recorded after 12 weeks of exposure to PAN in purified air. The corresponding L∗, a∗, b∗ and ΔE values measured after 1, 2, 4, 5, 6, 7, 8, 9, 10, 11, and 12 weeks of exposure are not included due to space limitations but are available elsewhere (Williams et al. 1991a). Also included in table 2 are the color changes recorded in a control experiment, i.e., 12 weeks of exposure to purified air alone (Williams et al. 1992) using the same air purification system and the same experimental protocols as those employed in this study. Listed in table 3 for unexposed and PAN-exposed colorants are the color parameters x, y, X, Y, Z, L∗, a∗, and b∗ calculated from the full 380–700 nm reflectance spectra recorded with the spectrophotometer. These spectra are not included due to space limitations but are also available elsewhere (Williams et al. 1991b). TABLE 2 SUMMARY OF RESULTS TABLE 3 COLOR PARAMETERS CALCULATED FROM 380–700 NM REFLECTANCE SPECTRA OF UNEXPOSED AND PAN-EXPOSED COLORANT SAMPLES For most colorants studied, exposure to 50 ppb of PAN for 3 months (equivalent to a total PAN dose of 603 ppb/wk) resulted in little or no color change. Thus, color changes after 3 months of exposure were ≤1.0 ΔE units for 9 colorants and ≤2.0 ΔE units for all but 3 colorants, chrome yellow (ΔE = 2.3), curcumin (ΔE = 4.2), and basic fuchsin (ΔE = 5.8). The relative contributions of changes in L∗, a∗, and b∗ to the measured ΔE were 6%, 28%, and 66%, respectively, for curcumin and 26%, 38%, and 36%, respectively, for basic fuchsin. Figure 4 illustrates for one colorant, curcumin, the variations of the parameters L∗, a∗, and b∗ as a function of the dose of PAN. For chrome yellow and basic fuchsin, which were coated on Whatman 41 paper, the measured ΔE may reflect the measurement uncertainty that resulted from nonuniform coating (due to limited colorant solubility in the solvents used for the coating solution).
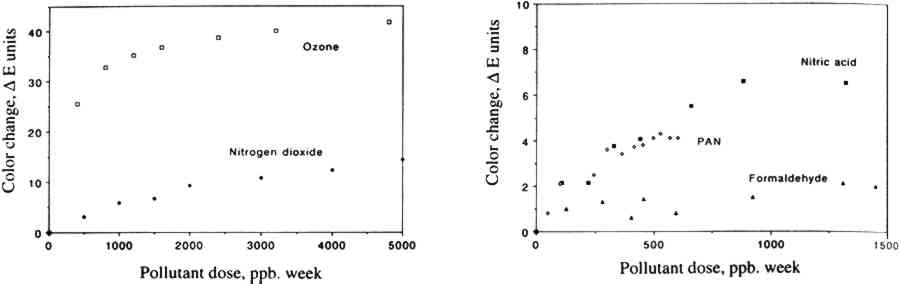
Within experimental precision, the small color changes measured for all but two colorants (basic fuchsin and curcumin) after exposure to PAN were essentially the same as (within one standard deviation), or even lower than, those observed on exposure to 3.3 IMPLICATIONS FOR MUSEUM COLLECTIONSWith the exception of curcumin and basic fuchsin, none of the several chemical functionalities tested—including inorganic colorants, natural organic colorants, and synthetic colorants such as arylamides and alizarin lakes—was found to be PAN-fugitive under the conditions tested. Since fugitiveness is closely correlated with colorant chemical functionality, as we have observed earlier for ozone (Grosjean et al. 1987, 1988a, 1988b, 1989), this conclusion can probably be extended to many other colorants that are structural homologues of those included in this study. Concentrations of PAN in museums have seldom been measured. In fact, there has been only one study of indoor PAN in hospitals and other public buildings (Thompson et al. 1973). prior to our recent surveys of museum air quality (Hisham and Grosjean 1991a, 1991b). The amount of PAN to which colorant-containing objects might be exposed in museums can be estimated from literature data for outdoor PAN concentrations and for indoor/outdoor PAN concentration ratios in museums (table 4). Outdoor levels of PAN may reach 30–50 ppb, with typical values of 5–10 ppb at many locations including those that have a high density of cultural property. Hisham and Grosjean (1991a, 1991b) found that the highest indoor PAN concentration was 14 ppb, and the highest outdoor PAN concentration was also 14 ppb. In museums that lack heating, ventilation, and air conditioning (HVAC) systems, are equipped with HVAC without chemical filtration, or are equipped with HVAC-chemical filtration systems that are not frequently serviced and properly maintained, indoor concentrations of PAN are 60–100% of outdoor levels (Hisham and Grosjean 1991a, 1991b). Thus, indoor PAN levels in museums may be as high as 18–50 ppb with typical values of 3–10 ppb. In these museums, it will take from 1 to 3 years for objects to be exposed to the same dose of PAN as the one to which artists' colorants were exposed in this study, i.e., 600 ppb/wk. On the other hand, the airborne PAN concentration in a museum equipped with a well-maintained HVAC-chemical filtration system may be as low as 1 ppb (Hisham and Grosjean 1991b). In this case, it would take about 12 years for art objects to be subjected to the same dose of PAN as the one we employed in this study. TABLE 4 LITERATURE DATA FOR OUTDOOR LEVELS OF PAN, INDOOR LEVELS OF PAN IN MUSEUMS, AND INDOOR/OUTDOOR PAN CONCENTRATION RATIOS The limitations of our study with respect to conservation practice are as follows. First, while all but two of the colorants tested were not PAN-fugitive, objects containing curcumin and basic fuchsin (and perhaps their structural homologues such as other triphenylmethanes) may be susceptible to damage by PAN. Second, objects usually reside in museums for periods longer than the 1–12 years we estimated to result in the same PAN dose as the one we employed in our study. Finally, colorants are only one of the many categories of materials present in museum collections. Should PAN be present in the museum environment at levels that may be of concern for objects susceptible to damage by oxidation, mitigation 3.4 COMPARISON WITH OTHER AIR POLLUTANTSAlso of interest in the context of this study is a comparison of color changes resulting from exposure to PAN to those resulting from exposure to other air pollutants that are often present in museum air. Compared in table 5 are color changes resulting from exposure, for about 3 months, to ozone, nitrogen dioxide, nitric acid, formaldehyde, and PAN. While these exposures involved pollutant concentrations (and therefore pollutant doses) that were lower for formaldehyde and PAN than those for ozone and nitrogen dioxide, we did not “scale up” the data in table 5 to a common pollutant concentration basis since color changes do not necessarily vary in a linear fashion with pollutant concentration. TABLE 5 COMPARISON OF COLOR CHANGE RESULTING FROM EXPOSURE, FOR 12 WEEKS, OF COLORANTS ON WATERCOLOR PAPER TO PEROXYACETYL NITRATE, OZONE, NITROGEN DIOXIDE, NITRIC ACID, FORMALDEHYDE, AND PURIFIED AIR With this caveat, the data in table 5 indicate severe ozone fading for several classes of colorants, (including natural colorants and alizarin lakes), measurable fading of some of the same colorants on exposure to nitrogen dioxide and to nitric acid, and little or no fading on exposure to formaldehyde and PAN. This result is illustrated in figure 5 for curcumin, whose color changes are plotted against pollutant dose for five major urban air pollutants, namely ozone, nitrogen dioxide, nitric acid, formaldehyde, and PAN.
The potential for damage to colorants in museum collections is a function of the pollutant concentration, the exposure duration, and the magnitude of the specific pollutant colorant interaction, i.e., fading and/or color change. Since levels of ozone in museum air are comparable to those of formaldehyde and nitrogen dioxide and are substantially higher than those of PAN and nitric acid, ozone should be of much greater concern than PAN with respect to damage to colorant-containing objects. ACKNOWLEDGEMENTSThis work has been supported by a contract with the Getty Conservation Institute (GCI), Marina del Rey, California. We thank Frank Preusser and James R. Druzik, GCI, for their technical advice; Eileen Sadoff and Bryan Amiri, GCI, for the preparation of many of the colorant samples employed in this study; Paul M. Whitmore, Carnegie Mellon Research Institute, Pittsburgh, Pennsylvania, for useful discussions on color measurements; and Glen R. Cass, California Institute of Technology, Pasadena, California, for permission to use the Match Scan instrument. Denise Yanez prepared the draft and final versions of the manuscript. |