EXPOSURE OF ARTISTS' COLORANTS TO PEROXYACETYL NITRATEEDWIN L. WILLIAMS, ERIC GROSJEAN, & DANIEL GROSJEAN
ABSTRACT—Thirty artists' colorants brushed on watercolor paper have been exposed for 3 months to 48 � 15 ppb of the photochemical air pollutant peroxyacetyl nitrate (PAN) in purified air. These exposures were carried out in the dark at ambient temperature (20 � 2�C) and humidity (RH = 45 � 10%). Color changes (L∗a∗b∗ and ΔE) were measured every week using a reflectance color analyzer. Color parameters (x, y, X, Y, Z, L∗, a∗, and b∗) were also calculated from the 380–700 nm spectra—recorded with a reflectance spectro-photometer—of unexposed colorants and of colorants exposed to PAN for 3 months. Regression analysis of the two data sets for colorants and for standard ceramic color tiles indicated that color changes measured by these two methods were in excellent agreement (near-unity slopes, correlation coefficients > 0.99). Exposure to PAN, which may be present in museum air in many areas of the world that are burdened with photochemical air pollution, resulted in little or no color change for all but two (curcumin and basic fuschin) of the colorants tested, including inorganic colorants, alizarin lakes, quinacridones, triphenyl methanes, arylamides, and natural colorants. A brief comparison is made of artists' colorant fading resulting from exposure to several air pollutants including PAN, ozone, nitrogen dioxide, nitric acid, and formaldehyde. 1 INTRODUCTIONAir pollutants such as sulfur dioxide and ozone have been recognized as a threat to cultural property for a number of years (Thompson 1978; Shaver et al. 1983; Baer and Banks 1985; Brimblecombe 1990). More recently, detailed surveys of air pollutant levels inside museums and of the corresponding indoor/outdoor concentration ratio have been carried out (Druzik et al. 1990; Hisham and Grosjean 1991a, 1991b). These studies have shown that a number of air pollutants—including ozone, nitrogen dioxide, peroxyacetyl nitrate, nitric acid, formaldehyde, and chlorinated hydrocarbons such as methyl chloroform and tetrachloro-ethylene—are frequently present in museum air. These studies have also brought into focus the need to assess possible damage resulting from exposure of works of art to air pollutants. Indeed, a number of artists' colorants have been shown to fade substantially when exposed to levels of ozone relevant to urban air quality (Shaver et al. 1983; Drisko et al. 1985; Whitmore et al. 1987; Whitmore and Cass 1988). Photochemical oxidants that are formed, along with ozone, in polluted urban air include nitrogen dioxide (NO2), nitric acid (HNO3), and peroxyacetyl nitrate (PAN, CH3C(O)OONO2). The effects of NO2 and nitric acid on colorants have been recently studied (Whitmore and Cass 1989; Salmon and Cass 1991; Grosjean et al. 1992). Thus, of the major photochemical oxidants that are nearly always present in polluted urban air, only PAN remains to be investigated for its possible threat to colorants and other materials relevant to museum collections. While air pollution scientists have studied PAN for more than 30 years, it may be less familiar to the art conservation community. Therefore, a brief summary of the properties of PAN relevant to this study is given here. PAN is the first and most abundant member of a family of compounds, the peroxyacyl nitrates (RC(O)OONO2, R = alkyl group), which were not known to chemists until they were identified in urban smog in the early 1960s (Stephens 1969). PAN and other peroxyacyl nitrates have no known direct sources and are therefore excellent indicators of photochemical pollution. They are formed in situ in the atmosphere in complex sets of reactions involving hydrocarbons (paraffins, olefins, aromatics) and oxides of nitrogen emitted by stationary (e.g., power plants or oil refineries) and mobile sources (e.g., automobiles, buses, or aircraft). These reactions are initiated by the hydroxyl radical (OH) and lead to aldehydes, which in turn react with OH and with nitrogen dioxide to form PAN and its homologues, e.g.:
Once formed in the atmosphere, PAN and other peroxyacyl nitrates may be removed by dry deposition to surfaces and by physical and chemical processes. Thermal decomposition, the reverse reaction in equilibrium (5) above, increases rapidly with increasing temperature. Thus, the atmospheric persistence of peroxyacyl nitrates is limited by their thermal stability. It is also limited in the presence of nitric oxide (a major air pollutant emitted by mobile and stationary sources) because of the rapid reaction between nitric oxide and the peroxyacyl radical formed in reaction (4) above:
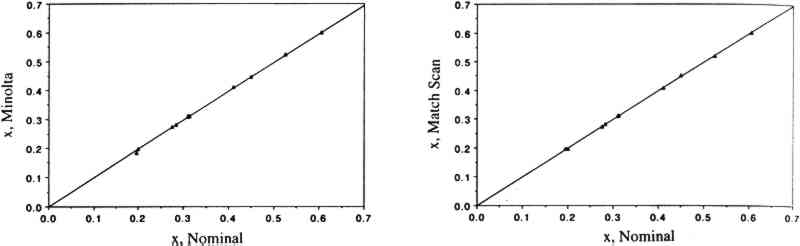
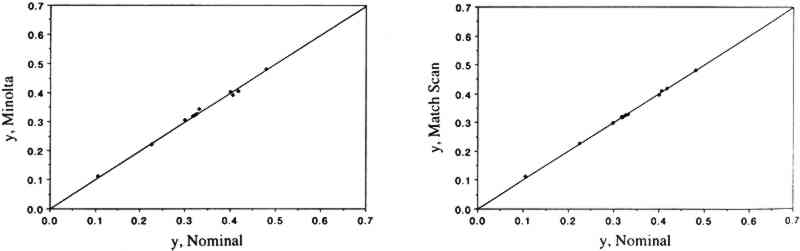
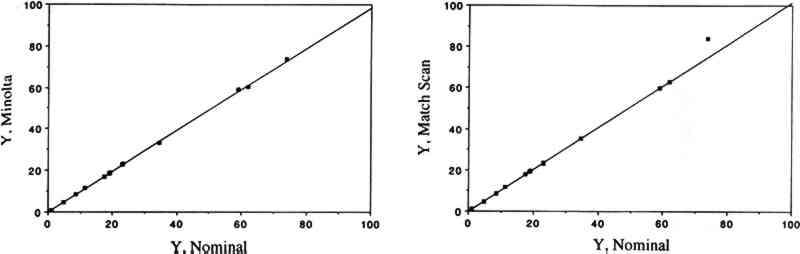
PAN and other peroxyacyl nitrates are mutagens, eye irritants, and phytotoxins (Peak and Belser 1969; Taylor 1969; Stephens 1969; Temple and Taylor 1983; Shepson et al. 1986). They are strong oxidants: like ozone, they oxidize potassium iodide, and this reaction serves as a basis for a widely used method to measure “total oxidants” in polluted air. PAN also oxidizes amino acids (Mudd 1966). While several of the adverse properties listed above may be directly relevant to objects of artistic or historical value, there is no information available regarding the effects of PAN and other peroxyacyl nitrates on materials. Peroxyacyl nitrate has been identified in urban air since the mid-1960s (Stephens 1969); its concentrations may reach 30–50 ppb during smog episodes (Stephens 1969; Grosjean 1984; Williams and Grosjean 1990). Thus, PAN is often the second most abundant oxidant (after ozone) in polluted ambient air. While PAN has been most often observed in the Los Angeles, California area (Williams and Grosjean 1990 and references therein), it is also present in all urban areas of the world that experience photochemical smog, including Rome, Mexico City, Cairo, Athens, and Rio de Janeiro (Tanner et al. 1988; Lalas et al. 1987; G�sten et al. 1988; Tsani-Bazaca et al. 1988; Nasralla and Shakour 1981; Grosjean et al. 1990). Several of these urban areas also have a high density of cultural property. While PAN is predominantly an outdoor pollutant, it has been observed inside public buildings (Thompson et al. 1973) including museums (Hisham and Grosjean 1991a, 1991b) at concentrations comparable to outdoor levels. In addition, computer simulations suggest that PAN may form indoors in well-lit buildings including museums (Nazaroff and Cass 1986) by chemical reactions involving NO2 and reactive volatile organics including acetaldehyde. Both nitrogen dioxide and acetaldehyde are frequently present in indoor air (Yocom 1982; Crump and Gardiner 1989) and have been observed in museum air in California (Hisham and Grosjean 1991a, 1991b) and in Brazil (Grosjean et al. 1990). In this article, we describe the methods and findings of an investigation focusing on color changes resulting from exposure of 31 artists' colorants to levels of PAN relevant to museum air quality. This study, while limited in scope to colorants, represents the first attempt to address the issue of possible PAN-induced damage to museum collections. The implications of our results with respect to PAN-induced damage are briefly discussed. The observed color changes are compared to those obtained for the same colorants exposed to other air pollutants, including ozone (Whitmore and Cass 1988), nitrogen dioxide (Whitmore and Cass 1989), nitric acid (Salmon and Cass 1991), and formaldehyde (Williams et al. 1992). 2 EXPERIMENTAL METHODS2.1 EXPOSURE CHAMBERThe colorants were exposed to purified air containing PAN in a 45 I cube-shaped chamber constructed from six 0.63 cm thick sheets of polymethyl methacrylate. Five sides of the chamber were sealed permanently with acrylic cement and the sixth (top) panel could be removed for periodic removal of colorant samples. A 2.9 cm wide collar coated with high-vacuum Teflon grease provided a leak-free seal between top and side panels. To minimize wall losses, the chamber was lined with clear Teflon film. Two small ports, inlet and exit, were located on opposite sides of the chamber. Additional details regarding the exposure chamber can be found in Williams and Grosjean (1992). 2.2 EXPOSURE PROTOCOLPurified air was obtained by passing ambient air through large beds of activated carbon, silica gel, and Purafil (perman-ganate-coated alumina). These sorbent beds were followed by a glass fiber filter, which removed particulate matter, if any, downstream of the sorbent beds. The purified air thus obtained contained no detectable amounts (i.e., less than 0.2−2.0 ppb depending on the detection limit of the instruments employed) of ozone, oxides of nitrogen, nitric acid, organic acids (formic and acetic acids), sulfur dioxide, hydrogen sulfide, formaldehyde (0.46 � 0.42 ppb), and acetaldehyde (0.97 � 0.79 ppb). The concentration of PAN in the purified air was less than our detection limit of 0.2 ppb. The colorant exposure was of 12.6 weeks duration and was carried out in the dark (the chamber was covered with sheets of opaque plastic) at room temperature (range 16–26�C, mean daytime temperature = 20.3�C with a standard deviation [SD] of � 2.0�C). Some humidity control was provided by the silica gel sorbent bed, with the resulting mean daytime RH being 45% (SD = � 10%, range 24–68%). PAN was synthesized in PAN was measured by electron capture gas chromatography (EC-CG) using an SRI Model 8610 GC and a Valco Model 140 BN EC detector (Williams and Grosjean 1990, 1991). The column used was a 90 cm � 3 mm Teflon column packed with 10% Carbowax 400 on Chromosorb P, acid washed, and treated with dimethyldichlorosilane. The column and detector temperatures were 40�C and 60�C, respectively. The carrier gas was ultra-high-purity nitrogen. The column flow rate was 40 ml/min. Air was continuously pumped from the chamber inlet and exit through two 6 mm diameter Teflon sampling lines and two 3 ml stainless steel loops housed in the GC oven and was injected alternately from the inlet and exit every 30 minutes using a timer-activated 10-port sampling valve. The instrument was calibrated against a chemiluminescent oxides of nitrogen (NOx) analyzer using parts per billion levels of PAN in purified air (Williams and Grosjean 1990, 1991). The aliquots of PAN in the constant output diffusion vial unavoidably contained small amounts of methyl nitrate (CH3ONO2), which is, along with carbon dioxide, a product of PAN decomposition. Methyl nitrate was measured along with PAN by EC-GC, and calibration of the EC-GC for methyl nitrate involved the synthesis of pure methyl nitrate and chemiluminescence measurements with a calibrated NOx analyzer. Methyl nitrate is not an oxidant and is not likely to have an effect on the colorants tested. With the exposure protocol described above, the concentrations of PAN to which the colorants were exposed were reasonably constant. Week-to-week fluctuations reflected (1) the need to refill periodically the diffusion vial with a fresh aliquot of the PAN solution in n-dodecane, and (2) occasional breakdowns of the air compressor or the tube containing the silica gel trap. Weekly averaged PAN concentrations measured at the inlet of the exposure chamber are listed in table 1 along with the corresponding cumulative averages. Also listed in table 1 are the cumulative doses of PAN to which the colorants were exposed. Comparison of the inlet and exit PAN concentrations showed that, on the average, 59 � 13% of the inlet PAN was removed by the colorant samples, their watercolor paper or cellulose substrate, their paper holders, and the associated hardware. The empty chamber lined with Teflon film removed less than 5% of the inlet PAN concentration. TABLE 1 WEEKLY AVERAGED PAN CONCENTRATION, CUMULATIVE PAN CONCENTRATION, AND CUMULATIVE PAN DOSE The exposure to PAN was interrupted for about 2� hours at the end of each week, for color change readings. The cumulative duration of color change readings was 2� hours, or 1% of the total exposure duration, during which the samples were exposed to indoor light and to indoor laboratory air containing only low levels of air pollutants 2.3 COLORANTS AND SAMPLE PREPARATIONThe colorants studied including natural organic compounds (e.g., gamboge), modern organic colorants (including Winsor and Newton artists' watercolors), and inorganic pigments (e.g., Prussian blue, chrome yellow). These colorants were selected for consistency with those already studied for their fugitiveness to ozone, nitrogen dioxide, and nitric acid. Most colorant samples were prepared by air brushing dilute suspensions onto sheets of watercolor paper. To investigate possible substrate-specific effects, a few colorant samples were coated on What-man 41 cellulose paper. The amount of colorant applied to watercolor paper was carefully adjusted to obtain an initial reflectance of about 40% at the minimum reflectance wavelength. The colorant samples thus prepared were exposed to PAN as 25 � 25 mm squares (watercolor paper) or 25 mm diameter discs (Whatman 41 paper). 2.4 COLOR MEASUREMENTSColor changes were measured by reflectance spectroscopy using two instruments, a Minolta color analyzer and a Bausch & Lomb reflectance spectrophotometer. The color analyzer was calibrated using a white reflector plate standard, and the light source standard was CIE illuminant C (CIE 1931 standard observer). The color analyzer's sample viewing area is 2 mm diameter. Additional calibration checks were carried out using a set of 12 standard ceramic color tiles (4 neutral grays and 8 chromatic standards) developed by the British Ceramic Research Association, Ltd., and calibrated at the National Physical Laboratory. The reflectance spectrophotometer was calibrated using a standard white tile referenced to an National Color changes can be reported using several color parameter systems including the parameters x, y, X, Y, Z, the CIE 1976 L∗ a∗ b∗ parameters, and Munsell color notations, among others. The color analyzer we employed features several measurement modes including L∗ a∗ b∗ and ΔE (see definition below). These and other color parameters can also be readily calculated from the full 380–700 nm reflectance spectra obtained with the spectrophotometer. In this study, we have elected to report color changes as ΔE, which is given by ΔE2 = ΔL2 + Δa2 + Δb2 where L∗a∗b∗ are the standard CIE 1976 coordinates for brightness (L∗) and chromaticity (a∗, b∗) and ΔE, ΔL, Δa, and Δb are the differences between exposed and unexposed colorant samples. This convention for reporting color changes is the same as that employed in earlier studies of colorants exposed to other air pollutants (Whitmore et al. 1987; Whitmore and Cass 1988, 1989). Using the color analyzer, the parameters L∗a∗b∗, and ΔE were measured after 1, 2, 4, 5, 6, 7, 8, 9, 10, 11, and 12 weeks of exposure. Using the spectrophotometer, the color parameters x, y, X, Y, Z, L∗,a∗, and b∗ were calculated from the reflectance spectra of the unexposed colorants and of the same colorants at the completion of the 12-week exposure to PAN. Other color parameters could be readily calculated if so desired from these chromaticity coordinates and from the corresponding reflectance spectra. The reflectance spectra (plots and computer printouts) and color analyzer L∗ a∗ b∗ readings made after 1, 2, and so on, weeks of exposure (computerized spread-sheets) are not included in this article due to space limitations but are available elsewhere (Williams et al. 1991a, 1991b). 2.5 PRECISION OF COLOR MEASUREMENTSFor the standard ceramic tiles, the relative standard deviation (RSD, i.e., the standard deviation divided by the mean value) was 0–0.7% (L∗), 0–12.4% (a∗), and 0–22% (b∗) for triplicate measurements on all tiles using the color analyzer. The RSD was less than 2% except when the chromaticity parameters a∗ and/or b∗ were < 1. For 6 sets of measurements on 2 tiles (red and cyan) with the spectrophotometer, the RSD was 0.1–0.6% (L∗), 0.7–0.9% (a∗), and 0.3–2.5% (b∗). For the colorant samples, the spectrophotometer's RSD for 8 sets of replicates was 0–1.25% (L∗), 0.1–2.9% (a∗), and 0.1–3.3% (b∗). The color analyzer's RSD (sets of triplicate samples for all colorants studied) was typically 1–3% (see section 3 below). For the color analyzer, multiple measurements on single samples were all within 0.2 ΔE units for measurements carried out on the same day and were within 5–10% of the mean ΔE value for measurements carried out up to 6 months apart. 3 RESULTS AND DISCUSSION3.1 COMPARISON OF THE TWO COLOR MEASUREMENT METHODSColor parameters measured using the color analyzer and the spectrophotometer were shown to be in good agreement for both standard ceramic tiles and for a set of 30 colorant samples. Linear regression analysis of the color parameters x, y, Y, L∗, a∗, and b∗ measured with the color analyzer and with the spectrophotometer vs. the corresponding nominal values for the standard ceramic tiles yielded near-unity slopes and correlation coefficients > 0.95. These linear relationships are shown for the color parameters x (fig. 1), y (fig. 2), and Y (fig. 3). The nominal values are those specified by the manufacturer for a “master set” of standard tiles. The good agreement between nominal and measured values indicate good accuracy for both instruments. Linear regression of the same color parameters for a set of 30 colorant samples (e.g., L∗, color analyzer vs. L∗, spectrophotometer) also yielded near-unity slopes and correlation coefficients of > 0.99 (Williams et al. 1992).
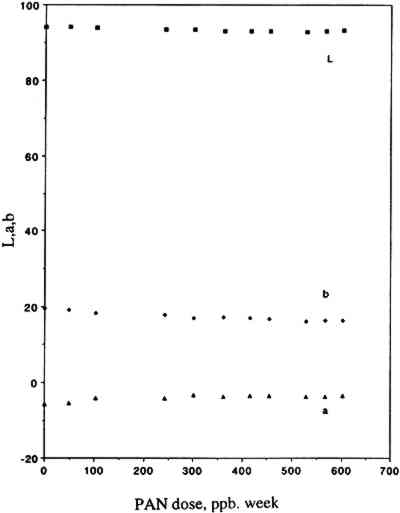
3.2 COLOR CHANGESOur results are summarized in table 2, which includes a list of the colorants studied, their origin, their chemical functionality (type of chromophore), the type of substrate employed for sample preparation, and the final color changes (ΔE, calculated from L∗, a∗, b∗ measured with the color analyzer) recorded after 12 weeks of exposure to PAN in purified air. The corresponding L∗, a∗, b∗ and ΔE values measured after 1, 2, 4, 5, 6, 7, 8, 9, 10, 11, and 12 weeks of exposure are not included due to space limitations but are available elsewhere (Williams et al. 1991a). Also included in table 2 are the color changes recorded in a control experiment, i.e., 12 weeks of exposure to purified air alone (Williams et al. 1992) using the same air purification system and the same experimental protocols as those employed in this study. Listed in table 3 for unexposed and PAN-exposed colorants are the color parameters x, y, X, Y, Z, L∗, a∗, and b∗ calculated from the full 380–700 nm reflectance spectra recorded with the spectrophotometer. These spectra are not included due to space limitations but are also available elsewhere (Williams et al. 1991b). TABLE 2 SUMMARY OF RESULTS TABLE 3 COLOR PARAMETERS CALCULATED FROM 380–700 NM REFLECTANCE SPECTRA OF UNEXPOSED AND PAN-EXPOSED COLORANT SAMPLES For most colorants studied, exposure to 50 ppb of PAN for 3 months (equivalent to a total PAN dose of 603 ppb/wk) resulted in little or no color change. Thus, color changes after 3 months of exposure were ≤1.0 ΔE units for 9 colorants and ≤2.0 ΔE units for all but 3 colorants, chrome yellow (ΔE = 2.3), curcumin (ΔE = 4.2), and basic fuchsin (ΔE = 5.8). The relative contributions of changes in L∗, a∗, and b∗ to the measured ΔE were 6%, 28%, and 66%, respectively, for curcumin and 26%, 38%, and 36%, respectively, for basic fuchsin. Figure 4 illustrates for one colorant, curcumin, the variations of the parameters L∗, a∗, and b∗ as a function of the dose of PAN. For chrome yellow and basic fuchsin, which were coated on Whatman 41 paper, the measured ΔE may reflect the measurement uncertainty that resulted from nonuniform coating (due to limited colorant solubility in the solvents used for the coating solution).
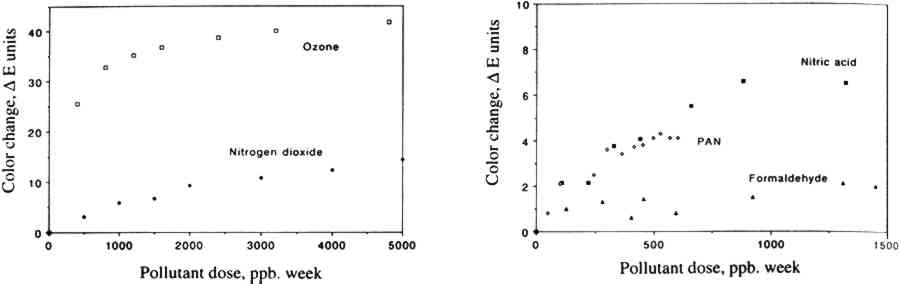
Within experimental precision, the small color changes measured for all but two colorants (basic fuchsin and curcumin) after exposure to PAN were essentially the same as (within one standard deviation), or even lower than, those observed on exposure to 3.3 IMPLICATIONS FOR MUSEUM COLLECTIONSWith the exception of curcumin and basic fuchsin, none of the several chemical functionalities tested—including inorganic colorants, natural organic colorants, and synthetic colorants such as arylamides and alizarin lakes—was found to be PAN-fugitive under the conditions tested. Since fugitiveness is closely correlated with colorant chemical functionality, as we have observed earlier for ozone (Grosjean et al. 1987, 1988a, 1988b, 1989), this conclusion can probably be extended to many other colorants that are structural homologues of those included in this study. Concentrations of PAN in museums have seldom been measured. In fact, there has been only one study of indoor PAN in hospitals and other public buildings (Thompson et al. 1973). prior to our recent surveys of museum air quality (Hisham and Grosjean 1991a, 1991b). The amount of PAN to which colorant-containing objects might be exposed in museums can be estimated from literature data for outdoor PAN concentrations and for indoor/outdoor PAN concentration ratios in museums (table 4). Outdoor levels of PAN may reach 30–50 ppb, with typical values of 5–10 ppb at many locations including those that have a high density of cultural property. Hisham and Grosjean (1991a, 1991b) found that the highest indoor PAN concentration was 14 ppb, and the highest outdoor PAN concentration was also 14 ppb. In museums that lack heating, ventilation, and air conditioning (HVAC) systems, are equipped with HVAC without chemical filtration, or are equipped with HVAC-chemical filtration systems that are not frequently serviced and properly maintained, indoor concentrations of PAN are 60–100% of outdoor levels (Hisham and Grosjean 1991a, 1991b). Thus, indoor PAN levels in museums may be as high as 18–50 ppb with typical values of 3–10 ppb. In these museums, it will take from 1 to 3 years for objects to be exposed to the same dose of PAN as the one to which artists' colorants were exposed in this study, i.e., 600 ppb/wk. On the other hand, the airborne PAN concentration in a museum equipped with a well-maintained HVAC-chemical filtration system may be as low as 1 ppb (Hisham and Grosjean 1991b). In this case, it would take about 12 years for art objects to be subjected to the same dose of PAN as the one we employed in this study. TABLE 4 LITERATURE DATA FOR OUTDOOR LEVELS OF PAN, INDOOR LEVELS OF PAN IN MUSEUMS, AND INDOOR/OUTDOOR PAN CONCENTRATION RATIOS The limitations of our study with respect to conservation practice are as follows. First, while all but two of the colorants tested were not PAN-fugitive, objects containing curcumin and basic fuchsin (and perhaps their structural homologues such as other triphenylmethanes) may be susceptible to damage by PAN. Second, objects usually reside in museums for periods longer than the 1–12 years we estimated to result in the same PAN dose as the one we employed in our study. Finally, colorants are only one of the many categories of materials present in museum collections. Should PAN be present in the museum environment at levels that may be of concern for objects susceptible to damage by oxidation, mitigation 3.4 COMPARISON WITH OTHER AIR POLLUTANTSAlso of interest in the context of this study is a comparison of color changes resulting from exposure to PAN to those resulting from exposure to other air pollutants that are often present in museum air. Compared in table 5 are color changes resulting from exposure, for about 3 months, to ozone, nitrogen dioxide, nitric acid, formaldehyde, and PAN. While these exposures involved pollutant concentrations (and therefore pollutant doses) that were lower for formaldehyde and PAN than those for ozone and nitrogen dioxide, we did not “scale up” the data in table 5 to a common pollutant concentration basis since color changes do not necessarily vary in a linear fashion with pollutant concentration. TABLE 5 COMPARISON OF COLOR CHANGE RESULTING FROM EXPOSURE, FOR 12 WEEKS, OF COLORANTS ON WATERCOLOR PAPER TO PEROXYACETYL NITRATE, OZONE, NITROGEN DIOXIDE, NITRIC ACID, FORMALDEHYDE, AND PURIFIED AIR With this caveat, the data in table 5 indicate severe ozone fading for several classes of colorants, (including natural colorants and alizarin lakes), measurable fading of some of the same colorants on exposure to nitrogen dioxide and to nitric acid, and little or no fading on exposure to formaldehyde and PAN. This result is illustrated in figure 5 for curcumin, whose color changes are plotted against pollutant dose for five major urban air pollutants, namely ozone, nitrogen dioxide, nitric acid, formaldehyde, and PAN.
The potential for damage to colorants in museum collections is a function of the pollutant concentration, the exposure duration, and the magnitude of the specific pollutant colorant interaction, i.e., fading and/or color change. Since levels of ozone in museum air are comparable to those of formaldehyde and nitrogen dioxide and are substantially higher than those of PAN and nitric acid, ozone should be of much greater concern than PAN with respect to damage to colorant-containing objects. ACKNOWLEDGEMENTSThis work has been supported by a contract with the Getty Conservation Institute (GCI), Marina del Rey, California. We thank Frank Preusser and James R. Druzik, GCI, for their technical advice; Eileen Sadoff and Bryan Amiri, GCI, for the preparation of many of the colorant samples employed in this study; Paul M. Whitmore, Carnegie Mellon Research Institute, Pittsburgh, Pennsylvania, for useful discussions on color measurements; and Glen R. Cass, California Institute of Technology, Pasadena, California, for permission to use the Match Scan instrument. Denise Yanez prepared the draft and final versions of the manuscript. REFERENCESBaer, N. S., and P. N.Banks. 1985. Indoor pollution effect on cultural and historical materials. International Journal of Museum Management and Curatorship4:9–20. Brimblecombe, P. 1990. The composition of museum atmospheres. Atmospheric Environment24B:1–8. Crump, D. R., and D.Gardiner. 1989. Sources and concentrations of aldehydes and ketones in indoor environments in the UK. Environment International15:455–62. Drisko, K., G. R.Cass, P. M.Whitmore, and J. R.Druzik. 1985. Fading of artists' pigments due to atmospheric ozone. In Wiener Berichte �ber Naturwissenschaft in der Kunst2/3, ed.A.Vendl, B.Pichler, and J.Weber. Vienna:Verlag ORAC. 66–87. Druzik, J. R., M. S.Adams, C.Tiller, and G. R.Cass. 1990. The measurement and model predictions of indoor ozone concentrations in museums. Atmospheric Environment24A:1813–23. Gaffney, J. S., R.Fajer, and G. I.Senum. 1984. An improved procedure for high purity gaseous peroxyacetyl nitrate production: Use of heavy liquid solvents. Atmospheric Environment18:215–18. Grosjean, D.1984. Comments on “Worldwide ambient measurements of peroxyacetyl nitrate (PAN) and implications for plant injury.”Atmospheric Environment18:1489–91. Grosjean, D.1990. Atmospheric chemistry of toxic contaminants, 2. Saturated aliphatics: Acetaldehyde, dioxane, ethylene, glycol ethers, propylene oxide. Journal of the Air Pollution Control Association40:1522–31. Grosjean, D., A. H.Miguel, and T. M.Tavares. 1990. Urban air pollution in Brazil: Acetaldehyde and other carbonyls. Atmospheric Environment24B:101–6. Grosjean, D., and S. S.Parmar. 1991. Removal of air pollutant mixtures from museum display cases. Studies in Conservation36:129–41. Grosjean, D., L.Salmon, and G. R.Cass. 1992. Fading of artists' colorants by atmospheric nitric acid: Reaction products and mechanisms. Environmental Science and Technology26:952–59. Grosjean, D., P. M.Whitmore, G. R.Cass, and J. R.Druzik. 1988b. Ozone fading of natural organic colorants: Mechanisms and products of the reaction of ozone with indigos. Environmental Science and Technology22:292–98. Grosjean, D., P. M.Whitmore, G. R.Cass, and J. R.Druzik. 1989. Ozone fading of triphenyl-methane colorants: Reaction products and mechanisms. Environmental Science and Technology23:1164–67. Grosjean, D., P. M.Whitmore, C. P.DeMoor, G. R.Cass, and J. R.Druzik. 1987. Fading of alizarin and related artists' pigments by atmospheric ozone: Reaction products and mechanisms. Environmental Science and Technology21:635–43.
Grosjean, D., P. M.Whitmore, C. P.DeMoor, G. R.Cass, and J. R.Druzik. 1988a. Ozone fading of organic colorants: Products and mechanisms of the reaction of ozone with curcumin G�sten, H., G.Heinrich, T.Cvitas, L.Klasinc, B.Ruscic, D. P.Lalas, and M.Petrakis. 1988. Photochemical formation and transport of ozone in Athens, Greece. Atmospheric Environment22:1855–61. Hisham, M.W.M., and D.Grosjean. 1991a. Air pollution in southern California museums: Indoor and outdoor levels of nitrogen dioxide, peroxyacetyl nitrate, nitric acid, and chlorinated hydrocarbons. Environmental Science and Technology25:857–62. Hisham, M.W.M., and D.Grosjean. 1991b. Sulfur dioxide, hydrogen sulfide, total reduced sulfur, chlorinated hydrocarbons, and photochemical oxidants in southern California museums. Atmospheric Environment25A:1497–1505. Lalas, D. P., M.Tombrou-Tsella, M.Petrakis, D. N.Asimako-poulos, and C.Helmis. 1987. An experimental study of the horizontal and vertical distribution of ozone over Athens. Atmospheric Environment21:2681–93. Mudd, B. J. 1966. Reaction of peroxyacetyl nitrate with glutathione. Journal of Biological Chemistry241:4077–80. Nasralla, M. M., and A. A.Shakour. 1981. Nitrogen oxides and photochemical oxidants in Cario atmosphere. Environment International5:55–60. Nazaroff, W. W., and G. R.Cass. 1986. Mathematical modeling of chemically reactive pollutants in indoor air. Environmental Science and Technology20:924–34. Nielsen, T., A. M.Hansen, and E. L.Thomsen. 1982. A convenient method for preparation of pure standards of peroxyacetyl nitrate for atmospheric analysis. Atmospheric Environment16:2447–50. Parmar, S. S., and D.Grosjean. 1991. Sorbent removal of air pollutants from museum display cases. Environment International17:39–50. PeakM. J., and W. L.Belser. 1969. Some effects of the air pollutant peroxyacetyl nitrate upon deoxyribonucleic acid and upon nucleic acid bases. Atmospheric Environment3:385–97. Shaver, C. L., G. R.Cass, and J. RDruzik. 1983. Ozone and the deterioration of works of art. Environmental Science and Technology17:748–52. Shepson, P. B., T. E.Kleindienst, E. O.Edney, C. M.Nero, L. T.Cupitt, and L. D.Claxton. 1986. Acetaldehyde: The mutagenic activity of its reaction products. Environmental Science and Technology20:1008–13. Stephens, E. R. 1969. The formation, reactions and properties of peroxyacyl nitrates in photochemical air pollution. Advances in Environmental Science and Technology1:119–46. Tanner, R. L., A. H.Miguel, J. B.de Andrade, J. S.Gaffney, and G. E.Strait. 1988. Atmospheric chemistry of aldehydes: Enhanced peroxyacetyl nitrate formation from ethanol-fueled vehicular emissions. Environmental Science and Technology22:1026–34. Taylor, O. C. 1969. Importance of peroxyacetyl nitrate as a phytotoxic air pollutant. Journal of the Air Pollution Control Association19:347–51. Temple, P. J., and O. C.Taylor. 1983. Worldwide ambient measurements of peroxyacetyl nitrate (PAN) and implications for plant injury. Atmospheric Environment17:1583–87. Thompson, C. R., E. G.Hensel, and G.Kats. 1973. Outdoor-indoor levels of six air pollutants. Journal of the Air Pollution Control Association23:881–86. Thompson, G. 1978. The museum environment. London: Butterworths.
Tsani-Bazaca, E., S.Glavas, and H.G�sten. 1988. Peroxyacetyl nitrate (PAN) concentrations in Athens, Greece. Atmospheric Environment22:2283–86. Whitmore, P. M., and G. R.Cass. 1988. The ozone fading of traditional Japanese colorants. Studies in Conservation33:29–40. Whitmore, P. M., and G. R.Cass. 1989. The fading of artists' colorants by exposure to atmospheric nitrogen dioxide. Studies in Conservation34:85–97. Whitmore, P. M., G. R.Cass, and J. R.Druzik. 1987. The ozone fading of traditional natural organic colorants on paper. Journal of the American Institue for Conservation26:45–58. Williams, E. L.II, and D.Grosjean. 1990. Southern California Air Quality Study: Peroxyacetyl nitrate. Atmospheric Environment24A:2369–77. Williams, E. L.II, and D.Grosjean. 1991. Peroxypropionyl nitrate at a southern California mountain forest site. Environmental Science and Technology25:653–59. Williams, E. L.II, and D.Grosjean. 1992. Exposure of deacidified and untreated paper to ambient levels of sulfur dioxide and nitrogen dioxide: Nature and yields of reaction products. Journal of the American Institute for Conservation31:199–212. Williams, E. L.II, E.Grosjean, and D.Grosjean. 1991a. Exposure of artists' colorants to peroxyacetyl nitrate. Final report to Getty Conservation Institute. Ventura, Calif: DGA, Inc. Williams, E. L.II, E.Grosjean, and D.Grosjean. 1991b. Exposure of artists' colorants to air pollutants: Reflectance spectra of exposed and unexposed samples. Final report to Getty Conservation Institute. Ventura Calif.: DGA, Inc. Williams, E. L.II, E.Grosjean, and D.Grosjean. 1992. Exposure of artists' colorants to airborne formaldehyde. Studies in Conservation, 37:201–10.. Yocom, J. E. 1982. Indoor-outdoor air quality relationships. Journal of the Air Pollution Control Association32:500–20. SOURCES OF MATERIALSActivated carbon (type BPL, 6–16 mesh)Calgon Corp., Pittsburgh, Pennsylvania Electron capture gas chromatographModel 8610, SRI, Inc., Redondo Beach, California FEP teflon film (type 200A)DuPont, Wilmington, Delaware Glass fiber filterWhatman Lab Sales, Hillsboro, Oregon High vacuum teflon greaseBaxter Scientific Products, Irvine, California Plexiglas (Acrylite FF)Gem-O-Lite Company, Ventura, California PurafilPurafil, Inc., Atlanta, Georgia Reflectance color analyzer chroma-meter model, Cr-121Minolta Corp., Ramsey, New Jersey Reflectance spectrophotometer: Diano Match Scan IIBausch and Lomb, Woburn, Massachusetts Silica gel (3–8 mesh)Aldrich Chemical Co., Milwaukee, Wisconsin Standard ceramic color tilesBritish Ceramic Research Associates, Ltd., Stoke-on-Trent, England Watercolor paper: 100% rag fiber, 140 lbs, neutral ph, hot-pressedPerrigot, Arches, France WatercolorsWinsor and Newton, Wealdstone, Harrow, Middlesex HA3 5RH, England; Binney and Smith, Grumbacher. Weld-on (acrylic plastic cement)Gem-O-Lite Company, Ventura, California Whatman 41 cellulose filtersWhatman Lab Sales, Hillsboro, Oregon AUTHOR INFORMATIONEDWIN L. WILLIAMS II holds an M.S. degree in physical chemistry from the University of California, Los Angeles (1986) and is a research scientist with DGA, Inc. He is involved in research projects including atmospheric chemistry, air pollution measurements, development and application of new analytical methods for the determination of trace levels of air pollutants, museum air quality, and studies of the impact of air pollutants on paper and on artists' colorants. ERIC GROSJEAN holds a B.A. degree in environmental sciences from the California State University, Northridge, California (1991) and is a research assistant at DGA, Inc. He is involved in research projects including laboratory studies of atmospheric chemical reactions, air pollution measurements in urban air, and indoor air quality and studies of the impact of air pollutants on artists' colorants. DANIEL GROSJEAN holds a docteur es Sciences degree in physical organic chemistry from the University of Paris (1972) and did postdoctoral research at the Department of Environmental Health Engineering, California Institute of Technology, Pasadena, California. He is president of a private environmental research company that he founded in 1983 and he directs research studies in atmospheric chemistry, air pollution measurements, museum air quality, and art conservation. He also holds an appointment as visiting associate, Department of Chemical Engineering, California Institute of Technology. Grosjean's recent work in the field of art conservation has included several surveys of air quality in museums, the design of mitigation measures such as the use of sorbents to remove air pollutants from display cases, the development of passive samplers for measuring formaldehyde and other pollutants in museum air, and studies of the impact of air pollutants on deacidified paper, artists' colorants, and other materials relevant to museum collections. Address: DGA, Inc., 4526 Telephone Rd., Ste. 205, Ventura, Calif. 93003.
 Section Index Section Index |