CORROSION MECHANISMS FOR COPPER AND SILVER OBJECTS IN NEAR-SURFACE ENVIRONMENTSMICHAEL B. McNEIL, & BRENDA J. LITTLE
2 STABILITY DIAGRAMSA fundamental tool for interpreting chemical phenomena is the stability diagram (Pourbaix 1966; Heimann 1989; Garrels and Christ 1965), which shows regions of thermodynamic stability for specified phases under particular restrictions. These diagrams—often called Pourbaix, phase, or pH-potential diagrams—are presented at fixed temperature and chemical conditions with axes of pH and Eh. pH is the negative logarithm of the effective hydrogen ion concentration used to express both acidity and alkalinity. Eh is a measure of the oxidation or reduction potential of the system. Low Eh values correspond to reducing conditions and high Eh values to oxidizing conditions.
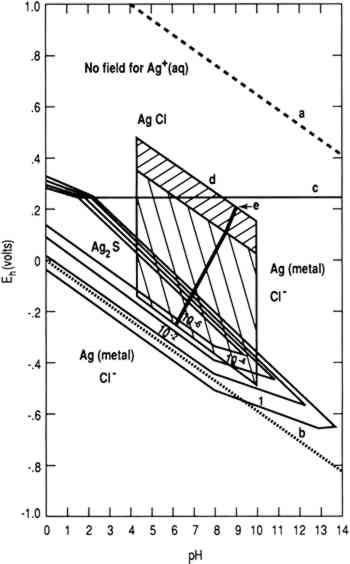
Figure 1 is a stability diagram for a silver-water-chloride-sulfur system constructed using thermodynamic data (Wagman et al. 1982). Line (a) is the oxygen line above which water is thermodynamically unstable
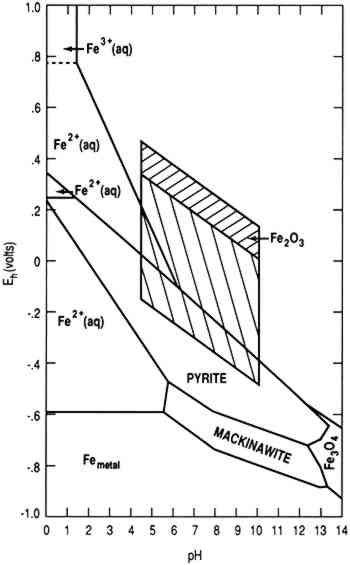
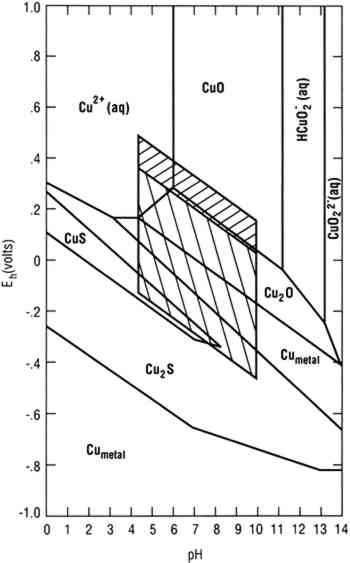
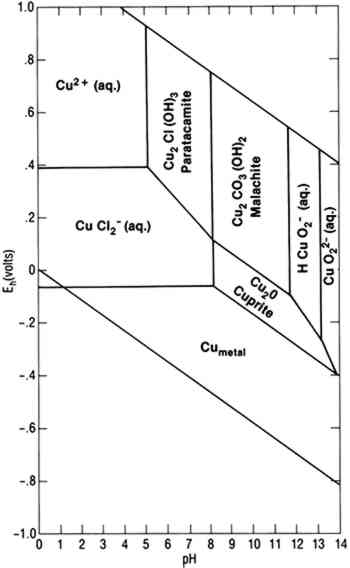
To achieve conditions at the surface of an artifact other than those defined by the two parallelograms requires the presence of a biofilm on the surface capable of maintaining conditions radically different from those in the bulk environment. Figure 1 indicates the possible thermodynamically stable phases for silver equilibrated with varying total sulfur compositions in 0.46 Molar NaCl (typical for seawater). It is assumed that reduced sulfur species (S−2, HS−, H2S) are in equilibrium. The area of the diagram above line (c) is the stability region for cerargyrite. Below line (c) metallic silver is stable, except for the wedge-shaped areas pointing down and to the right indicating regions of stability for monoclinic acanthite (Ag2S). Figure 2 is a similar diagram for an iron-water-reduced sulfur system with lines for 10−6 M dissolved iron and 10−2 M total reduced sulfur. Figure 3 is a stability diagram for copper and its minerals drawn for 10−6 M total dissolved copper and 10−2 M total reduced sulfur. Figure 4 is a stability diagram for copper that represents the condition when no sulfur is present and the electrolyte has the same chloride concentration as seawater and is in carbonate equilibrium with air. Total carbonate content (CO3−2, HCO3−, H2CO3) is assumed to be in equilibrium with air. Stability regions for red cuprite (Cu2O), malachite (Cu2(OH)2CO3), and paratacamite (Cu2(OH)3Cl) are shown. Thermodynamic data (excluding malachite) are from Wagman et al. (1982); malachite data are from Woods and Garrels (1966). Azurite (Cu3(OH)2(CO3)2) and georgite (Cu5(CO3)3(OH)4�6H2O) are not included. There are no thermodynamic data for georgite, and azurite has no stability field in water having carbonate content in equilibrium with air.
Stability diagrams can be used to analyze corrosion processes in the following way: A uniform coating of a particular mineral on the surface of an artifact indicates that surface conditions were such that the corrosion product was thermodynamically stable with respect to the metal and probably to other possible corrosion products. For example, some mechanistic information can be derived from the observation that the surface of a copper artifact was coated with azurite rather than malachite. Azurite is less stable than malachite in waters where the carbonate content is controlled by equilibrium with air. Azurite indicates that the artifact corroded Similarly, the formation of chalcocite (Cu2S) rather than covellite (CuS) in the presence of reduced sulfides provides evidence that surface conditions were such that chalcocite was stable. Conditions within a biofilm may be such that covellite is the stable product, but chalcocite may be detected in an x-ray diffraction pattern because it is present as an underlayer between the covellite and the copper alloy. Mass transport can lead to partial sulfidation of copper to chalcocite, then to covellite. Copper artifacts corroded in the absence of sulfides or sulfate-reducing bacteria (SRB) generally have a red cuprite layer under malachite or paratacamite. Equilibrium with the aqueous phase is limited to the outermost layer unless the corrosion product is porous. Based on the assumption that conditions are in local equilibrium, knowledge of electrolyte chemistry on the microscopic scale must be used in the analyses of corrosion product mineralogy. Two-dimensional presentations of phase equilibria controlled by two independent variables are adequate for corrosion processes influenced by redox behavior. Redox equilibria are not critical in determining corrosion processes in some cases, and more complex diagrams are required. For example, copper corrosion associated with simultaneous formation of cuprite and nantokite (CuCl) under a coating of cuprite is characteristic of both bronze disease (Scott 1990a) and type 2 pitting (Lucey 1967; Sato 1982). In other cases, corrosion products are divalent copper minerals (generally paratacamite in salt water and malachite or brochantite (Cu4SO4(OH)6) in fresh water). The corrosion chemistry is determined by the phase relationships of a number of cupric minerals. To present the phase equilibria in two-dimensional diagrams, it is necessary to construct projections of phase stability regions on planes perpendicular to the pH and Eh axes in four-dimensional figures with coordinate axes of pH, Eh, chloride activity, and copper activity. Explanations for using four-dimensional diagrams can be found in Zen (1966). Four-dimensional phase diagrams have also been used to interpret corrosion phenomena in bronze disease (Mohr and McNeil 1992; Scott 1990a) and type 1 pitting in copper. |