EXPOSURE OF DEACIDIFIED AND UNTREATED PAPER TO AMBIENT LEVELS OF SULFUR DIOXIDE AND NITROGEN DIOXIDE: NATURE AND YIELDS OF REACTION PRODUCTSEDWIN L. WILLIAMS, & DANIEL GROSJEAN
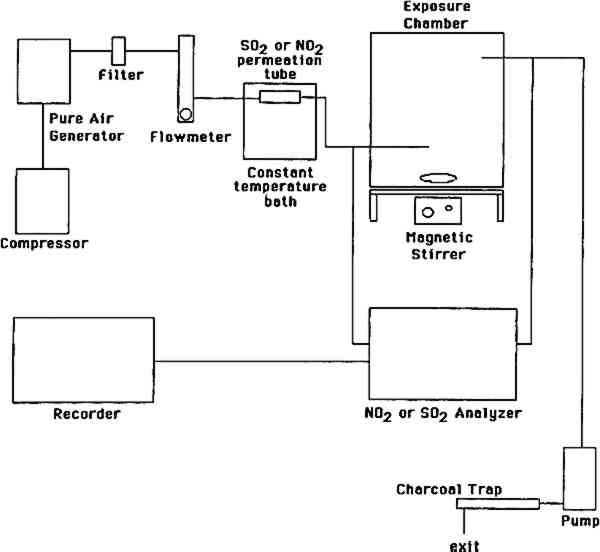
ABSTRACT—This project was aimed at investigating the nature and yields of the reaction products resulting from exposure of deacidified and untreated paper to ambient levels of sulfur dioxide and nitrogen dioxide, separately and as a mixture. Two types of paper, newsprint and white wove, were used. Both SO2 and NO2 were absorbed throughout the 13- to 29-week exposures and were removed at the same rate whether present alone or as a mixture. The paper had a larger capacity for uptake of SO2 than for uptake of NO2. Sulfate was the only sulfur-containing product observed irrespective of paper type, deacidified or not, and accounted for 65 � 30% of the absorbed SO2. Newsprint contained more sulfate than did white wove, and untreated paper had the lowest sulfate yields. Sulfite, bisulfite, and other oxidizable sulfur-containing products were absent. Nitrite and nitrate, the two nitrogen-containing products observed, together accounted for all of the absorbed NO2. Deacidified paper yielded both nitrite and nitrate; untreated paper yielded only nitrate. The ratio of nitrate + nitrite to sulfate was lower in deacidified paper (0.2–0.5%) than in untreated paper (0.6–2.0%). Nitrite accounted for 41% of the total (nitrate + nitrite) upon exposure to NO2 alone but for only 9% upon exposure to NO2 in the presence of SO2. 1 INTRODUCTIONDamage to works of art and historical records on paper is a major focus of conservation efforts. The Library of Congress, for example, estimated in 1984 that 25% of its collection (some 3 million volumes), had become too brittle for circulation. Recognition of the degradation of paper is not new: in 1338 A.D. King Pedro IV of Spain issued a decree demanding the improvement of paper manufacturing (McCleary 1981). Paper degradation is largely due to the acid hydrolysis of the glycosidic linkages in cellulose (Smith 1975). Paper may be acidic because of the bleaching products, rosin sizing, and alum, and components of incompletely processed fibers such as lignin, hemicellulose, and resin extractives resulting from the manufacturing process. Paper may also become acidic by absorption of acidic atmospheric pollutants. Paper deacidification neutralizes the acidic content of paper and leaves an alkaline reserve for the uptake of acidic pollutants. To preserve works of art and historical records, paper deacidification has become a protection measure widely practiced in the conservation community (Mihram 1986; Bredereck et al. 1990; Lienardy and Van Damme 1990; and references therein). The major acid pollutants—sulfur dioxide (SO2) and nitrogen dioxide (NO2)—are ubiquitous in urban air worldwide (Bennett et al. 1985; DeKoning et al. 1986), with typical ambient concentrations of 5–50 parts per billion (ppb) for SO2 and 50–200 ppb for NO2. Reaction products of sulfur dioxide and nitrogen dioxide in the atmosphere and on surfaces include The degradation of paper by SO2 has been investigated by Jarrell et al. (1936). Edwards et al. (1968), Langwell (1955, 1959), Atherton et al. (1973). Hudson et al. (1964), and, more recently, by Daniel et al. (1990). These studies have involved SO2 concentrations of 1,000–10,000 ppb that is, 20–2,000 times higher than those found in ambient air. A potential problem with using such high SO2 concentrations, at which SO2 readily forms sulfuric acid aerosol in air at ambient humidity, is that the observed damage may be due to uptake of H2SO4 rather than SO2. Another problem with these high SO2 concentrations is that the alkaline reserve (e.g., carbonate) is depleted rapidly, and the observed damage is no longer relevant to deacidified paper. Thus it is important to study the SO2-paper system at much lower SO2 concentrations relevant to polluted air. In this way no sulfuric aerosol is produced, and therefore chemical and physical changes, if any, can be unambiguously attributed to uptake of SO2. To our knowledge, no one has directly measured the expected products of SO2 adsorption—sulfite, bisulfite, and sulfate—on paper. Nor have the reaction products resulting from exposure of paper to nitrogen dioxide been investigated. Such product studies are important for paper conservation, since to understand the chemistry taking place when paper is exposed to air pollutants one must know what compounds accumulate in the paper as reaction products. Accordingly, our study was aimed at investigating the nature and yields of the reaction products resulting from exposure of deacidified and untreated paper to ambient levels of sulfur dioxide and nitrogen dioxide. Two types of paper were tested white wove and newsprint, each with three types of treatment—untreated, deacidified using an aqucous method, and decidified using a nonaqucous method. Four exposures were camed out, one to purified air (control, duration 11 weeks), one to purified air containing SO2 (87 ppb, 29 weeks), one to purified air containing NO2 (92 ppb. 13 weeks), and one to purified air containing both SO2 and NO2 (108 and 98 ppb. respectively, for 13 weeks). Paper samples were withdrawn from the exposure chamber weekly or biweekly and were analyzed for sulfate, bisulfite, sulfite, nitrate, and nitrite. Humidity was controlled to the extent provided by a large bed of silica gel in the air purification system used and daytime relative humidity was typically 60 � 10%. Within that range, variations in RH have no effect on the chemical reactions between paper and SO2 and/or NO2. This range of RH also provides a realistic model for the many buildings and historic houses in which paper is stored and which are not equipped with heating, ventilation, and air conditioning or other means of achieving strict humidity control. 2 EXPERIMENTAL METHODS2.1 EXPOSURE CHAMBERSThree identical cube-shaped exposure chambers were constructed, each made of six sheets of 35.6 cm � 0.63 cm thick polymethyl methacrylate (Acrylite FF). The chamber volume was 45 I and its surface-to-volume ratio was 16.9 m−1. Five sides of the chamber were sealed permanently with acrylic plastic cement (Weld-On); the sixth (top) panel could be removed for handling of paper samples. A 29 cm wide external collar coated with high-vacuum Teflon grease provided a leak-proof seal between top and side panels. The chamber was lined inside with clear FEP Teflon film (Dupont 200 A), using double-sided tape (Scotch 665). Two small Piexiglas ports, inlet and exit, each 0.63 2.2 PAPER TYPES AND DEACIDIFICATION PROCESSESTwo types of paper were tested, white wove and newsprint. They were identical to those recently studied by Daniel et al. (1990) at much higher levels of SO2. The white wove was 100% bleached chemical pulp book paper, sized with rosin and starch and coated with clay. The newsprint was 60% mechanical pulp–40% bleached chemical pulp paper without any sizing or coating. Both paper types were tested (1) untreated, (2) deacidified in an aqueous solution, and (3) deacidified in a nonaqueous solution. Whatman paper (100% cellulose) and Teflon filters were also included for comparison. Nonaqueous deacidification was carried out with a 50:50 solution of Wei T'o solution 3 and reagent alcohol. Wei T'o solution 3 contains methyl methoxy magnesium carbonate and volatile organic solvents. The solution was brushed onto the paper vertically and horizontally, saturating the paper, with the paper under vacuum on a suction table and a clean blotter between the paper and the table surface. The paper was allowed to dry under vacuum before removal from the table. Aqueous deacidification was carried out in a solution prepared by bubbling carbon dioxide through a solution of 200 g magnesium carbonate in 15 gal deionized water. The paper sheets were soaked for 3 hours in this solution and allowed to dry in air overnight. Both deacidification processes provided the paper with an alkaline reserve in the form of magnesium carbonate. Finally, deacidified and untreated paper samples were cut into 4 � 4 cm squares and suspended in the exposure chambers in an evenly spaced 9 � 5 � 5 matrix using mercerized cotton thread connected to small plastic hooks. These hooks were cut from 0.5 cm long sections of 1.3 cm outside diameter Plexiglas tubing and were cemented on opposite sides of the exposure chambers. 2.3 AIR POLLUTANT SOURCES AND MEASUREMENT METHODSThe experimental apparatus is schematically shown in figure 1. SO2 and NO2 were obtained from permeation tubes (VICI Metronics) kept at constant temperature (30.0 � 0.1�C) in a water bath. A nylon filter was inserted downstream of the NO2 permeation tube to remove nitric acid, if any. Particle-free, purified air was obtained by passing room air through large beds of silica gel, Purafil (permanganate and alumina), activated carbon, and a glass fiber filter. Silica gel, while contributing along with carbon and Purafil to the removal of air pollutants, also acted as a “buffer” of the matrix air humidity. The mean daytime relative humidity (RH) and temperature for the exposures to purified air, to SO2, to NO2, and to the SO2 + NO2 mixture were 63 � 11, 57 � 8, 62 � 7, 62 � 7 % and 19 � 2, 21 � 2, 19 � 2, 19 � 2 �C, respectively. Temperature and RH readings were not taken at night. Actual mean temperature and RH were probably somewhat higher and lower, respectively, than the daytime averages given above.
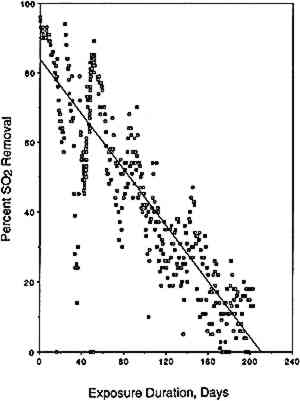
The purified air thus obtained was used as the matrix air for dilution of the permeation tubes Throughout the exposures, SO2 and NO2 were measured at the chamber inlet and exit using calibrated continuous analyzers. SO2 was measured by pulsed fluorescence (Monitor Labs 8850) and NO2 was measured by chemiluminescence (Monitor Labs 8840). Both instruments were calibrated using certified permeation tubes according to U.S. Environmental Protection Agency-approved methods. Control experiments were carried out to assess removal of SO2 and NO2 by the empty Teflon-lined chambers. The empty chambers removed only 5% of the inlet SO2 and NO2 concentrations. 2.4 PAPER EXTRACTION AND LIQUID CHROMATOGRAPHY ANALYSISPaper samples were withdrawn from the chamber every week or every other week, placed in vials containing 4 ml of deionized water and 16 μl of HPLC-grade chloroform as a biocide, and stored at refrigerator temperature. The addition of a biocide is critical to sample stability, as nitrate is rapidly consumed by bacteria. The samples were extracted by sonication for 20 minutes; 1.5 ml aliquots were filtered over a 0.2 μm pore-size, 4 mm diameter nylon syringe filter and were stored refrigerated in glass vials sealed with Teflon-lined screw caps. Control samples (unexposed paper stored refrigerated in the dark) and the corresponding blanks (vials containing only deionized water and chloroform) were included in all cases. Samples were analyzed for nitrite and bisulfite by liquid chromatography with ultraviolet Samples were analyzed for nitrate and sulfate by liquid chromatography with indirect ultraviolet detection at 275 nm as is described in detail elsewhere (Williams and Grosjean 1990). The method involves separation on a low-capacity anion exchange column (Hamilton PRP-X-100) with dilute sodium benzoate eluent (5 mM sodium benzoate, eluent flow rate 1.0 ml/min). Calibration involved the use of external standards (i.e., dilute solutions of sodium nitrate and sodium sulfate in deionized water). Analytical detection limits are 75 and 90 ng for nitrate and sulfate, respectively, for 100 μl injections. These limits correspond to detection limits of 3 μg per paper sample for nitrate and 6 μg per paper sample for nitrate and 6 μg per paper sample for sulfate. Multiple injections of standard solutions yielded RSDs of 3.5% and 2.6% for nitrate and sulfate, respectively. Replicate analysis of paper samples yielded RSDs of 13.9% for nitrate (range = 0–100%, 17 sets of replicates) and 10.1% for sulfate (range = 0–75%, 17 sets of replicates). Samples located next to the pollutant inlet generally contained more sulfate, nitrite, and nitrate than those at other locations within the chamber. With the exception of these samples, anion concentrations in extracts from a given type of paper, deacidification method, and exposure duration appeared to be randomly distributed, thus indicating reasonable mixing of SO2 and NO2 throughout the exposure chamber. 2.5 EXPOSURE PROTOCOLFour separate exposures were carried out, one to purified air containing no detectable amounts of SO2 and NO2 (control), one to purified air containing SO2 (87 ppb), one to purified air containing NO2 (92 ppb), and one to purified air containing both SO2 (108 ppb) and NO2 (98 ppb). The durations of the exposures to purified air, SO2, NO2 and SO2 + NO2 were 11, 29, 13, and 13 weeks, respectively. 3 RESULTS AND DISCUSSION3.1 ABSORPTION OF SO2 AND NO2 BY PAPERThe amount of pollutant removed by the paper is given by the product of the air flow rate, the exposure duration, and the difference between pollutant inlet and outlet concentrations. The rate of pollutant removal is given by the ratio of the amount removed and the exposure duration. The amount of pollutant removed can be expressed on a relative basis, for example as a dimensionless fraction of the inlet polutant concentration:
This percentage, when plotted as a function of exposure duration, is indicative of changes an pollutant removal rate during the experiment,
Similar plots, not shown here but available elsewhere (Williams and Grosjean 1990), were obtained for NO2 removal in the NO2 exposure as well as for NO2 and SO2 removal in the exposure to a mixture of NO2 and SO2. The amount removed and the removal rates for SO2 and for NO2 were the same whether tested alone or as a mixture. Thus, not unexpectedly, uptake of SO2 and NO2 proceeded independently of each other's presence. Overall, the paper samples had a substantially larger capacity for uptake of SO2 than for uptake of NO2. For example, it took 40 days of exposure to NO2 (with or without SO2 present) for the paper samples to remove 10% of the NO2 and 200 days to remove the same fractional amount of SO2. This difference can be rationalized in terms of carbonate-pollutant interactions. It is well known that carbonate-coated substrates “collect” SO2 with high efficiency. In fact, several of the methods widely used to measure SO2 in ambient air involve sampling through carbonate-impregnated paper or glass fiber discs. Carbonate retains SO2 and other acids (hydrochloric acid, formic acid, acetic acid) with 100% efficiency but retains only a small fraction of the NO2(Okita and Ohta 1979; Grosjean et al. 1989; Grosjean 1990). 3.2 CAPACITY OF EXPOSED PAPER FOR ADDITIONAL POLLUTANT ABSORPTIONTwo observations suggest that the exposed paper still had capacity for more pollutant absorption. First, the paper samples were still absorbing 50% of the inlet SO2 concentration at the end of the 13-week exposure to the SO2 + NO2 mixture. Second, the initial carbonate content (estimated from gravimetric analysis) was larger than the amount of pollutant absorbed (calculated from inlet and exit concentrations and exposure duration). The initial carbonate content, in units of micromoles per
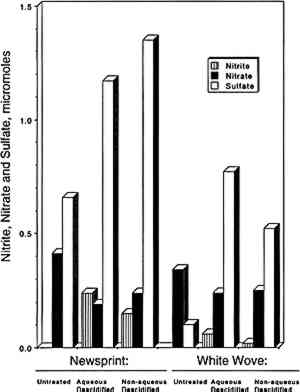
To further examine the paper capacity for additional absorption of NO2 and SO2, two exposures were repeated using much higher pollutant concentrations. Paper samples that had been exposed to 92 ppb of NO2 for 13 weeks were re-exposed to 1,200 ppb of NO2 for 4 days. During this second exposure, the paper samples removed 10–20% of the NO2. In the same way, paper samples that had been exposed to 100 ppb of the SO2-NO2 mixture were re-exposed to 1,000 ppb SO2 and 1,000 ppb NO2 for 7 days. Removal of SO2 was initially 80% and then gradually decreased to 20%; removal of NO2 was initially 65% and then decreased to 20%. These results clearly show that the paper samples could still absorb more NO2 and SO2 after 13 weeks of exposure to 100 ppb of NO2 or NO2 and SO2. 3.3 REACTION PRODUCTSThe reaction products identified included sulfate, nitrate, and nitrite, which were observed in all samples analyzed. Neither sulfite nor bisulfite was observed (detection limit = 6 μg per sample). Results for individual samples are not included due to space limitations and are available elsewhere (Williams and Grosjean 1990). Average sulfate, nitrate, and nitrite concentrations measured at the end of the expsoures are listed in table 1 and are summarized in figure 3. Several observations can be derived from these results:
TABLE 1 SULFATE, NITRATE, AND NITRITE CONTENT OF PAPER EXPOSED TO SULFUR DIOXIDE AND NITROGEN DIOXIDE
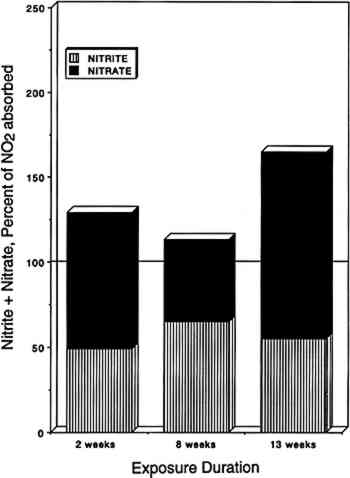
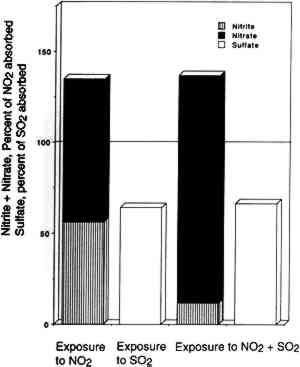
3.4 NITROGEN AND SULFUR MASS BALANCESCompared in table 2 are the amount of SO2 and NO2 absorbed (calculated from chamber inlet and exit concentrations, exposure duration, and chamber flow rate and corrected for the small amount lost to the chamber walls), and the amount of sulfate, nitrite, and nitrate measured in the paper samples by liquid chromatography. The same comparisons are illustrated in figure 4 for nitrate + nitrite vs. absorbed NO2 after 2, 8, and 13 weeks of exposure. Figure 5 compares TABLE 2 SULFUR AND NITROGEN MASS BALANCES FOR PAPER SAMPLES EXPLOSED TO SULFUR DIOXIDE AND NITROGEN DIOXIDE
Since only a small fraction of the total sample population, 2–5%, was withdrawn from the chamber at weekly or biweekly intervals, there is substantial scatter in the data summarized in table 2. Nevertheless, these comparisons indicate, that, on the average and within experimental uncertainty (see appendix), all of the absorbed NO2 could be accounted for as nitrate + nitrate, and sulfate accounted for 65 + 30% of the absorbed SO2. 3.5 NO2 ABSORPTIONUpon NO2 absorption on paper, nitrite may form by hydrolysis and by iron-catalyzed oxidation:
3.6 SO2 ABSORPTIONSulfur dioxide initially dissolves in aqueous media to form bisulfite and sulfite (S(IV)) as follows:
However, no S(IV) species could be detected in any of the sample extracts, thus suggesting that all bisulfite and/or sulfite initially present had been oxidized to sulfate either in the paper or during sample extraction and/or storage prior to analysis. There are many pathways for the oxidation of S(IV) to sulfate, S(VI). These include reaction with dissolved ozone, hydrogen peroxide, nitrite, or NO2; reaction with oxygen catalyzed by carbon; or oxidation catalyzed by transition metal ions such as iron, manganese, and copper. All pathways except those catalyzed by transition metal ions are unlikely to be important in our study since the oxidant To further investigate chemical reactions possibly taking place at the paper surface, several unextracted paper samples were analyzed by electron spectroscopy (ESCA) for sulfate, sulfite, bisulfite, sulfur, nitrate, nitrite, nitrogen, carbonate, carbon, oxygen, and trace metals (Williams and Grosjean 1990). One sample of each type was analyzed after exposure to the SO2 + NO2 mixture. With a detection limit equal to 0.1% of the total sample area scanned, no nitrite, nitrate, or carbonate could be detected. Deacidified newsprint contained sulfur, S(IV), in the form of sulfite or bisulfite (1%). Untreated newsprint contained oxidized sulfur, S(VI), that is, sulfate (1%). 3.7 TESTS FOR S(IV) OXIDATION DURING SAMPLE EXTRACTIONSince sulfite and bisulfite are easily oxidized to sulfate, they may actually be present after paper exposure to SO2 and may only be subsequently oxidized to sulfate during sample extraction. Thus, two experiments were carried out to test for the presence of sulfite or bisulfite in unextracted samples. In the first experiment, one-half of a paper sample exposed to SO2 for 29 weeks was extracted and was immediately analyzed for sulfate, while the other half was extracted with a 0.4% formaldehyde-water solution and then analyzed for sulfate. Any sulfite or bisulfite present would react with formaldehyde to form stable addition compounds:
Both samples were found to contain the same amount of sulfate, 116 � 16 μg, indicating that the original sample did not contain sulfite or bisulfite. In the second experiment, one-half of a paper sample exposed to SO2 + NO2 for 13 weeks was extracted and analyzed for sulfate. The other half of the sample was exposed to a flow of 1.2 ppm of gaseous formaldehyde in purified air for 16.5 hours (1600 μg of H2CO) prior to extraction. The unexposed and formal-dehyde-exposed samples contained 103 � 15 μg and 118 � 17 μg of sulfate, respectively. Again, if sulfite or bisulfite had been initially 3.8 BISULFITE STABILITY TESTAnother experiment was carried out to ascertain whether bisulfite could be oxidized on the paper sample or during extraction. One-half of a refrigerated control sample of aqueous-deacidified newsprint was extracted and analyzed for sulfate. The other half was spiked with 148 μg of bisulfite and allowed to dry prior to extraction and analysis. The control sample contained no detectable sulfate, as expected. The sample spiked with bisulfite contained 52 μg of sulfate, that is, 35% of the bisulfite was oxidized to sulfate prior to or during extraction. The spiked sample was reanalyzed after 20 hours. The sulfate content was the same, indicating that any bisulfite present in the extract was stable with respect to oxidation to sulfate for at least 20 hours after extraction. Results of the ESCA (electron spectroscopy) surface analysis, formaldehyde test, and bisulfite 3.9 TEST FOR OTHER SULFUR-CONTAINING REACTION PRODUCTSTo test for the presence of oxidizable sulfur compounds other than sulfite and bisulfite, a 5% hydrogen peroxide solution was added to an extracted, SO2-exposed sample. The sample treated with peroxide was re-analyzed for its sulfate content. No additional sulfate was found, thus indicating that no other oxidizable sulfur compounds were present. 4 CONCLUSIONSWe have investigated the nature and yields of the reaction products resulting from exposure of paper, deacidified or not, to ambient levels of sulfur dioxide and nitrogen dioxide. These reaction products include sulfate, nitrate, and nitrite, whose yields and relative abundance vary with paper type and treatment. The two deacidification methods employed led to an ample carbonate reserve in the paper. Since carbonate is an efficient sink for SO2, more sulfate accumulated in deacidified paper than in untreated paper. With carbonate thus acting as a “decoy,” less or no SO2 will react with the paper itself, thus minimizing damage. However, the accumulation of sulfate (in our case as magnesium sulfate) within the paper may not be beneficial, as is suggested by copper number and other results reported by Daniel et al. (1990) for deacidified paper exposed to high levels of SO2. On the other hand, results obtained at high levels of pollutants may have limited relevance to the issue of paper damage resulting from exposure to ambient polluted air. While current concern focuses on SO2, our results for NO2 are perhaps even more relevant for two reasons. First, concern about acid rain has prompted the implementation of control measures for SO2 emissions worldwide. As ambient levels of SO2 continue to decrease, the relative contribution of oxides of nitrogen (NO and NO2) to atmospheric acidity becomes increasingly important (in fact, atmospheric acidity in southern California and other urban areas is already dominated by NOx emissions). Second, chemical filtration systems do not remove NO2 as well as they remove other pollutants such as SO2 and ozone, thus resulting in high indoor NO2 concentrations in museums and in other settings where papers of artistic and historical value are displayed or stored (Hisham and Grosjean 1991). ACKNOWLEDGEMENTSThis work has been sponsored by the Getty Conservation Institute, Marina del Rey, California. We thank Fran�oise Flieder of the Centre de Recherches sur la Conservation des Documents Graphiques, Paris, for the paper samples, and Victoria Blyth-Hill of the Los Angeles County Museum of Art, for the preparation of deacidified paper. Helen Burgess of the Canadian Conservation Institute, James R. Druzik of the Getty Conservation Institute, Fran�oise Flieder of the CCRDG, Frank Preusser of the Getty Conservation Institute, and one anonymous reviewer provided valuable technical information. Denise Yanez prepared the draft and final versions of the manuscript. Part of this work was presented as part of the Book and Paper Specialty Group Session at the 19th AIC annual meeting, 1991. APPENDIX1 APPENDIX1.1 MEASUREMENT UNCERTAINTIESUncertainties in nitrite, nitrate, and sulfate concentrations were calculated by propagation of errors. Linear calibration plots of peak height vs. μg of analyte injected were prepared each day samples were analyzed. The slopes and intercepts of the calibration plots were used to calculate the analyte concentration:
Refrigerated controls and extraction solvent blanks contained some sulfate and nitrate but no nitrite. Thus, for nitrite, σC could be estimated directly from equation E2 and ranged from 1 to 8 μg per sample (equivalent to 5–19% for samples containing more than 10 μg nitrite). For nitrate and sulfate, concentrations in the paper samples were calculated by subtracting the nitrate and sulfate concentrations of the refrigerated controls and solvent blanks from the measured concentrations as follows:
where σA, σR, and σB are the uncertainties in the analyte concentration of the paper sample, the refrigerated control, and the solvent blank, respectively. For nitrate, uncertainties calculated using equation E4 ranged between 1 and 6 μg per sample (5–27% for samples containing more than 10 μg nitrate), with a mean of 3 μg. For sulfate, uncertainties ranged between 5 and 32 μg per sample (2–63% for samples containing more than 10 μg sulfate), with a mean of 16 μg. REFERENCESAtherton, J. B., F. L.Hudson, and J. A.Hockey. 1973. The effect of temperature, light and some transitional metal ions on the sorption of sulphur dioxide by paper. Journal of Applied Chem. Biotechnol23:407–14. Bennett, B. G., J. G.Kretzschmar, G. G.Akland, and H. W.de Koning. 1985. Urban air pollution worldwide. Environmental Science and Technology19:298–304. Bredereck, K., A.Haberditzl, and A.Bl�her. 1990. Paper deacidification in large workshops: Effectiveness and practicability. Restaurator11:165–78. Daniel, F., F.Flieder, and F.Leclerc. 1990. The effects of pollution on deacidified paper. Restaurator11:179–207.
DeKoning, H. W., J. G.Kretzschmar, G. G.Akland, and B. G.Bennett. 1986. Air pollution in different cities around the world. Atmospheric Environment20:101–14. Edwards, C. J., F. L.Hudson, and J. A.Hockey, 1968. Sorption of sulphur dioxide by paper. Journal of Applied Chemistry18:146–48. Grosjean, D.1990. Liquid chromatography analysis of chloride and nitrate with “negative” ultraviolet detection: Ambient levels and relative abundance of gas phase inorganic and organic acids in southern California. Environmental Science and Technology24:77–81. Grosjean, D., A.Van Neste, and S. S.Parmar. 1989. Analysis of atmospheric carboxylic acids using single column ion exclusion chromatography with ultraviolet detection. Journal of Liquid Chromatography12:3007–17. Hisham, M. W. M., and D.Grosjean. 1991. Air pollution in southern California museums: Indoor and outdoor levels of nitrogen dioxide, peroxyacetyl nitrate, nitrogen dioxide and chlorinated hydrocarbons. Environmental Science and Technology25:857–62. Hudson, F. L., R. L.Grant, and J. A.Hockey. 1964. The pick-up of sulphur dioxide by paper. Journal of Applied Chemistry14:444–47. Jarrell, T. D., J. M.Hankins, and F. P.Veitch. 1936. Deterioration of books and record papers. USDA Technical Bulletin 541, Washington, D.C.:U.S. Department of Agriculture. Langwell, W. H.1955. The permanence of paper, part 4. Technical Bulletin of Paper and Board Makers Association36(1):199–207. Langwell, W. H.1959. The permanence of paper, part 6. Technical Bulletin of Paper and Board Makers Association40(1):105–107. Lienardy, A., and P.Van Damme. 1990. Practical deacidification. Restaurator11:1–21. McCleary, J. P.1981. Paper conservation in Spain. In Preservation of paper and textiles of historic and artistic value II, ed.J. C.Williams. Advances in Chemistry series no. 193. Washington, D.C.: American Chemical Society. Mihram, D.1986. Paper deacidification: A bibliographic survey. Restaurator7:81–98. Okita, T., and S.Ohta1979. Measurements of nitrogenous and other compounds in the atmosphere and in cloudwater: A study of the mechanism of formation of acid precipitation. In Nitrogenous Air Pollutants: Chemical and Biological Implications, ed.D.Grosjean. Ann Arbor, Mich.: Ann Arbor Sciences Publisher. 289–306. Smith, R. D.1975. The deacidification of paper and books. American Libraries6(2):108–10. WilliamsE. L., II, and D.Grosjean. 1990. Exposure of deacidified and untreated paper to ambient levels of SO2 and NO2: Final report to the Getty Coservation Institute. Ventura, Calif.: DGA, Inc. AUTHOR INFORMATIONEDWIN L. WILLIAMS II holds a M.S. degree in physical chemistry from the University of California, Los Angeles, and is a research scientist with DGA, Inc. Address: DGA, Inc., 4526 Telephone Road, Suite 205, Ventura, Calif. 93003. DANIEL GROSJEAN holds a docteur es sciences degree in physical organic chemistry from the University of Paris and has done postdoctoral research at the California Institute of Technology, Pasadena, California. He is president of DGA, Inc., a private environmental research company founded in 1983 and directs research studies in atmospheric chemistry, air pollution measurements, museum air quality, and art conservation. Address: DGA, Inc., 4526 Telephone Road, Suite 205, Ventura, Calif. 93003.
 Section Index Section Index |