OBSERVATIONS ON THE DRYING OF PAPER: FIVE DRYING METHODS AND THE DRYING PROCESSJANE E. SUGARMAN, & TIMOTHY J. VITALE
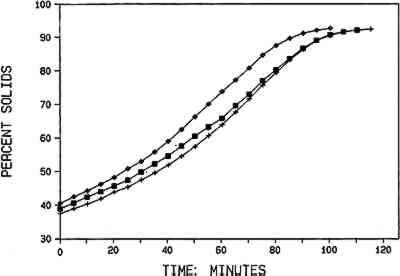
5 EXPERIMENT 2: QUANTIFICATION OF THE DRYING PROCESSIn this experiment the paper-drying process was observed and quantified to determine why the application of restraint between absorbent flat surfaces was important to the final surface texture of the test papers. The distinguishing feature of the most successful method for preserving surface texture—the early restraint method—is that the sheet is put under restraint in a wetter condition than in the traditional and uncushioned methods. 5.1 EXPERIMENTAL DESIGNA group of seven papers representing a range of ages, compositions, and surface appearances were selected (table 3). In the procedure detailed in appendix 1, each sample (8 � 10 cm) was immersed in water, then carefully monitored while it air dried on a balance accurate to 10−4 grams. The samples were supported on a stainless steel screen and suspended above a source of reflected light, in the balance. A visual description and weight measurement were recorded by a single observer at 5-minute intervals for three samples of the seven papers. TABLE 3 PAPERS USED TO QUANTIFY THE DRYING PROCESS Three samples of each test paper were observed by the same person as they dried. Each of the individual drying experiments yielded a high level of agreement within a set of three samples and among the seven papers. This agreement is reflected in (1) the similarity of plots in figure 3, and (2) the ranges of percent solids listed for the observed drying stages in table 4.
TABLE 4 STAGES OBSERVED DURING DRYING OF EXPERIMENTAL PAPERS 5.2 DRYING STAGES OBSERVEDThe samples were observed to pass through a series of discrete visual stages. When first removed from the bath, the sample is flooded (stage 1). When the sample is placed on the drying screen, the surface appears glossy. The overall glossiness fades fairly quickly, with patches of dark matte surface texture interrupting the overall specular gloss (stage 2). The surface water creates a specular gloss that hides the texture of the fibers and the dark translucency of the sheet. The water-filled paper is translucent. The dark appearance was due to light passing through the sheet rather than scattering at interfaces of large refractive index difference, such as between air and cellulose. The matte texture is due to the individual water-swollen fibers forming a rough surface, in comparison to a smooth, unbroken surface formed by a continuous water layer. The dark matte appearance is achieved after all of the “flooded” water evaporates from the surface (stage 3). While remaining matte in appearance, the dark tone slowly decreases as the translucency decreases. The reducing translucency, due to decreasing water content, shades into opacity as light is scattered from the newly formed air-water and air-cellulose interfaces. Eventually Not all of the papers went through all of the stages. Samples that were relatively thin tended to have only one identifiable matte stage. Their appearance changed from glossy and translucent to matte and opaque. It should be noted that the experimental design emphasized the papers' translucency. Drying on a blotter would diminish perceptible translucency because there is little light reflected from below. In figures 4 and 5, the drying time is plotted against percent solids at 5 minute intervals.
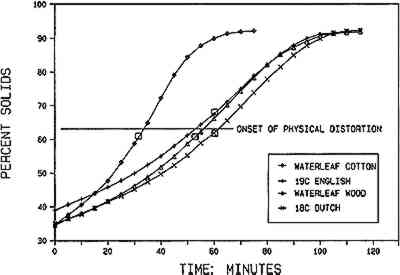
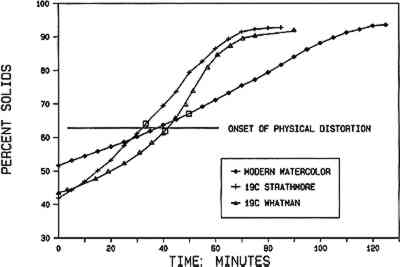
5.3 TWO GROUPS OF PAPERS DISTINGUISHED BY DEGREE OF SIZINGThe seven papers were studied extensively as to porosity,6 thickness, fiber type, shape, and degree of beating or age-related damage (as expressed in the measure of relative fiber length).7 It became clear after quantification of the drying process that the one factor that was a predictor of drying behavior was degree of sizing. If plots for all seven experimental papers were overlaid onto the same graph, (1) two distinct groups can be delineated on the basis of groupings of percent solids at specific drying stages, and (2) one drying stage is constant in both groups: onset of physical distortion. The seven experimental papers can be classified as unsized or lightly sized (group 1) and sized with gelatin and alum-rosin (group 2). Group 1 papers had relatively long drying times that start at lower percent solids (higher water content). Group 2 papers start the drying process with less absorbed water; thus their drying times are shorter. When a paper is immersed in water, the pores fill with water and the fibers begin the process of absorbing water and swelling. Depending on degree of beating and degree of sizing, the fibers eventually absorb water into their accessible micropore structure and across all of the accessible hydrogen-bonded sites. Historically, sizing is applied to paper by the papermaker to hinder water absorption into the fiber and thus prevent the feathering of water-based ink lines. It is clear, then, that the role played by the fibers in the adsorption and desorption processes is significant. In unsized papers the relative accessibility of the fibers to water causes greater water absorption and swelling, while in sized papers the role of the fibers is diminished, with the pore system dominating the drying process. Sizing or lack of it, then, accounts for most of the differences in patterns of drying. Group 2 papers begin at higher percent solids content (less water) and show rather distinct drying phases. Note that in figure 5 the starting percent solids for group 2 papers is 42%–52% solids. The watercolor paper, which is manufactured with a high degree of sizing, has the highest percent solids—52% (lowest water content). Compare this to the figure 4 starting percent solids of 34%–38%. Distinctness of drying stage is a function of progressing to the next stage in a crisp, direct manner without the (time) smearing effects due to slower evaporation of water from the fibers. The function of sizing is to decrease the amount of moisture the fibers absorb. With a large number of potential sites for water absorption occupied by sizing material, the fibers become only partially saturated. Fibers in sized papers act more like glass fibers in a mat, with water taken up and released predominantly through the pore system, (assuming the pore systems are relatively unclogged by the sizing). In unsized papers, the fibers contain more water and hold onto moisture much longer; thus the drying process is extended. One important finding should be emphasized: both groups exhibited the onset of physical distortion at 63% solids. The process that creates distortion must therefore be independent of the amount of water uptake and speed of drying.
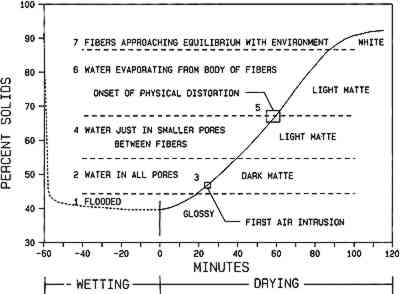
figures 4 and 5 reveal that one paper in each group has a plot that, on first observation, appears 5.4 DRYING STAGES OF PAPER DEFINEDThe drying stages observed on the seven experimental papers can be related to the literature on the formation, consolidation, and drying of never-dried pulp into paper, although once-dried paper is different from never-dried paper pulp. In experiment 2, the appearance of the paper is described for each state of drying (fig. 6). Figure 6 shows the seven stages of drying for an average paper based on the observations made in experiment 2.
5.4.1 Stage 1. Flooded: GlossyWhen the paper is removed from the bath, it is flooded and appears glossy. Water is in a continuous film throughout the paper. Pores, lumens, fiber micropores, and fibers are full. 5.4.2 Stage 2. Water in all pores: Glossy with regions of dark matteThis initial drying phase involves the removal of excess water. The excess water, beyond the free water held in the paper pores, decreases without the intrusion of air (Robertson 1963). As excess surface water continues to evaporate, free water remains in all pores, and the surface is no longer covered with a continuous film. Eventually the overall glossy appearance is broken up by dark matte regions. The matte texture is caused by fibers on the surface that are no longer covered by the flood of water. Saturation of the pores (normally air-filled voids) with liquid creates a dark appearance; the paper is highly translucent; no light is scattered at interfaces between water and fibers. Light transmission through the sheet is at a maximum, and scattering is at a minimum (Robertson 1963). 5.4.3 Stage 3. First air intrusion into large pores: Dark matte-translucentIn previous stages water formed a continuous film throughout the paper, surrounding each fiber and each fiber-to-fiber contact point. At this stage, the fibers and paper pores are full of free water, but there is no excess water. As water volume decreases due to evaporation, the largest pores begin to lose a small amount of water. Air begins to intrude into the sheet. However imperceptible, the sheet is slightly lighter in tone due to the increased scattering of light at the small increase in air/fiber surface area. 5.4.4 Stage 4. Water in smaller pores: Light matteFree water is in most of the pores at the start of this stage. As the stage progresses, the largest pores are the first to empty. The paper becomes light matte as more air intrudes into the pore structure of the paper, creating additional air/cellulose interfaces. Toward the end of this stage only the smaller pores contain water. A precise characterization of the differences between light and dark matte is impossible; it is a subjective judgment. The increasing number of sites in which there is a difference in refractive index between cellulose and air cause increased light scattering and reduced transmission of light. The progressive effect is an increasingly opaque appearance. As air intrusion increases, the constant rate of drying in the first stage of evaporation (Rance 1954) ends. Robertson (1963) describes this as the point when free water is not mobile enough to maintain a stationary evaporation zone at the face of large pores close to the surface. Free water exists, but its mobility is limited to a small region defined by the zone of contact between two fibers. Capillary action holds the water in the small pores of the zone surrounding the fiber-to-fiber bonding regions. Note that the light matte stage extends past the onset of physical distortion (stage 5), described below. 5.4.5 Stage 5. Onset of physical distortion: Hydrogen bonding and shrinkageOnset of physical distortion is the point within the light matte stage when bonding and shrinkage start. Bonding fixes fibers to one another so that as shrinkage occurs, localized differences are transferred to the network. The result is sheet distortion. It is quite possible that some fibers begin to shrink prior to the creation of hydrogen bonds between fibers. Shrinkage of the fiber network before this point is primarily in the z-direction (thickness). Monitoring the thickness of the samples as they dried was not undertaken in these experiments. This phenomenon has been When the localized free water of a region is in only the smallest pores—those between fibers at fiber-to-fiber contact areas—the surface tension of the water and the size of the capillary between the fibers result in a capillary force that draws the fiber surfaces together (Rance 1954). Eventually the fibers are drawn physically close enough for hydrogen bonds to form; this is at approximately 2.7 �, surface-to-surface distance (Skelton 1975; Christiansen and Giertz 1966). Fiber-to-fiber bonding begins at approximately 45% solids in a never-dried sheet (Robertson 1963). We have found the bonding begins in once-dried paper at 63 � 3% solids. Fibers shrink because they lose bound water. Evaporation of bound water can occur only when free water, or free water associated with the surface of the fiber, is gone. When bonding begins, no free water is available by definition, because it is all associated with fiber-to-fiber bonding zone. In a region of bonding, fiber segments not participating in bonding do not have free water surrounding them. The lack of free water along the exposed fiber shaft, which would have replaced evaporating bound water, causes the fibers to shrink locally. Evaporation of bound water in the fiber is a local phenomenon causing additional uneven shrinkage along the fiber. Concurrent hydrogen bonding and fiber shrinkage cause distortion of the fiber network. With the contact points between fibers fixed by hydrogen bonding, the shrinking fibers begin to distort the network, moving regions out of their original x-y planes into the z-direction. When enough displacement in the z-direction has occurred, distortion can be seen in the paper. Uneven drying always leads to sheet distortion. If the paper is allowed to dry without restraint in the z-direction, cockling will occur because the edges dry more quickly than the center. It is clear that the hydrogen-bonding process continues after the original establishment of hydrogen bonds, because tensile strength increases throughout the evaporation process (Robertson 1970). Shrinkage of the bonded fibers continues until the bound water content comes into equilibrium with the humidity content of the air. 5.4.6 Stage 6. Water evaporating from the fibers: Light matteThis stage is the latter half of the light matte stage, which began at stage 4. It is not visibly different from the stage 4 and was not observed as a distinct stage when the experimental observations were quantified but was added to increase clarity in the presentation of the drying process. The light matte stage is clearly divided, however, by the onset of physical distortion. In this stage, bound water is primarily evaporating from the body of the fiber. A small amount of water associated with the bonding sites is also concurrently evaporating. The sheet continues to be a light matte tone. The primary cause of increased sheet lightening is additional light scattering from air-cellulose interfaces within the fibers. Prior to this stage, the fibers were saturated and dark; during this stage the drying fibers are becoming lighter. The same phenomenon of air intrusion into the sheet also holds true for the fibers. As more air intrudes, the effect is an increasingly opaque appearance of the fibers. The water content passes through the fiber saturation point when all free water is gone, prior to the evaporation of bound water. At that point the voids in the fibers are empty, but the walls of the fibers are still saturated (Christiansen and Giertz 1966). At a point beyond the fiber saturation point (approximately 19 � 5% water), the translucency of the fiber begins to 5.5 SEVEN FIBERS APPROACHING EQUILIBRIUM WITH ENVIRONMENT: WHITEAs the fibers approach equilibrium with environment, the paper appears white due to almost total air intrusion. Small amounts of water continue to diffuse through the fiber to an evaporation surface. Within the drying fiber, evaporation does not continue indefinitely; it continues until an equilibrium moisture content is reached with the surrounding air. Under normal conditions the percent water content of the sheet will always be greater than zero unless an effort (such as exposure to hot drying oven conditions) is made to remove the bound water (Christiansen and Giertz 1966). The average for the seven experimental papers at 50% RH was 6% solids. |