PHOTOLUMINESCENCE SPECTROSCOPY OF NATURAL RESINS AND ORGANIC BINDING MEDIA OF PAINTINGS
LONDA J. LARSON, KYEONG-SOOK KIM SHIN, & JEFFREY I. ZINK
3 EXPERIMENTAL PROCEDURE
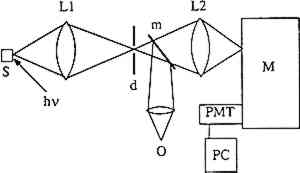
THE MEASUREMENT of luminescence spectra requires four pieces of equipment: a light source for excitation of the sample, a device to disperse the emitted radiation by wavelength, a detector, and a recorder. Samples were provided by the Getty Conservation Institute (GCI) and analyzed by laser-induced luminescence spectroscopy. Figure 2 illustrates the experimental configuration. Samples were mounted on a copper block inside a Displex closed-cycle helium refrigeration unit equipped with a thermocouple and a heater. The temperature could be varied continuously from room temperature to 10K. A continuous-wave argon-ion laser served as the excitation source. The laser beam was focused onto the sample, which absorbed the light. Emission from the sample was collected at approximately 45� from the laser beam, sent through a Spex model 1702 3/4-meter single monochromator, and then detected by an RCA C31034 photomultiplier tube. The signal from the photomultiplier tube was processed through an EG&G model 1105 photon counter and stored digitally in a computer. In practice, the sensitivity of the instrument varies with wavelength, causing distortions in the spectra, and spectra are usually reported as either “uncorrected” or “corrected” for instrumental response. The spectra shown in this article were corrected for instrumental response.
Fig. 2.
Diagram of the experimental set-up for collection of luminescence spectral data. The components are: (hv) laser exciting light, (S) sample, (LI) collecting lens, (d)diaphragm, (m) swing-away mirror, (O) ocular, (L2) focusing lens, (M) Spex 3/4 meter single monochromator, (PMT) photomultiplier tube, and (PC) photon counter.
 |
The materials studied are listed in table 1. The materials were previously characterized by infrared spectroscopy at the GCI. The bulk materials were in the form of either lumps or powders. Several samples dated to the 1930s, obtained from the Fogg Art Museum, Harvard University, were included in the study. Some of the Fogg samples were in the form of films cast onto glass from solutions of the bulk material. These films were removed from the glass substrate and studied as powders mounted on the copper block. In addition, several films were cast of selected modern bulk materials, either from turpentine, mineral spirits, ethanol, or water solutions of the materials. The films, listed in table 2, were cast onto aluminum foil from 5% solutions after filtration through one layer of cheesecloth. Only the soluble and partly soluble materials were cast as films and then studied. A film sample of manila copal dated 1920–23 was also prepared. In all cases, blanks consisting only of the backing material were studied to be certain that the luminescence spectrum originated from the authentic sample. No interferences from the backing material were found.
In the experiments performed, samples ranged from a few millimeters to about 150 microns in size, while the spatial resolution of the laser beam was approximately 100 microns in diameter. However, spatial resolution on the submicron level is possible (Salath� and Gilgen 1985).
In principle, laser-induced luminescence spectroscopy is nondestructive, but sample decomposition may occur if excessive heating or photochemical reactions take place. For the samples studied, it was possible to obtain emission spectra without decomposing the sample.
The spectra shown in figures 3–11 were all normalized to 100. Thus the plotted intensities are in units of percent of the intensities of the peak maxima. The samples studied tended to exhibit broad emission maxima. The estimated uncertainty in determining the maxima for such broad peaks is �100 cm−1. Peak widths are reported with the same uncertainty.
Fig. 3.
Room temperature luminescence spectra of: (A) casein, (B) egg yolk on glass (1937), and (C) linseed oil, 10% turpentine (1934). The excitation wevelength was 363.8 nm.
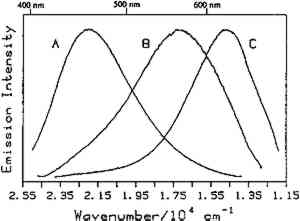 |
Fig. 4.
Room temperature luminescence spectra of: (A) whole egg in presence of lead white (1939), (B) whole egg and linseed oil in the presence of lead white (1939), and (C) linseed oil in the presence of ;lead white (1939). The excitation wavelength was 363.8 nm.
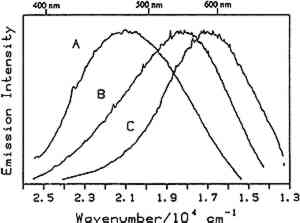 |
Fig. 5.
Room temperature luminescence spectra of: (A) gun tragacanth and (B) gum arabic. The excitation wavelength was 363.8 nm.
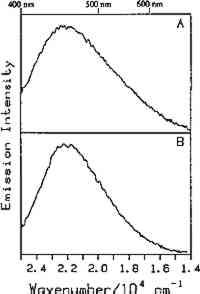 |
Fig. 6.
Room temperature luminescence spectra of: (A) orange shellac, (B) orange shellac film cast from ethanol onto foil (1988), and (C) orange shellac film cast from ethanol onto glass (1932). The excitation wavelength was 363.8 nm.
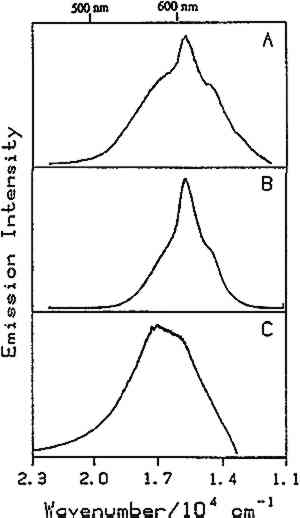 |
Fig. 7.
Luminescence spectra of sandrac at 10K showing excitation wavelength dependence: (A) 351.1 nm excitation and (B) 457.9 nm excitation
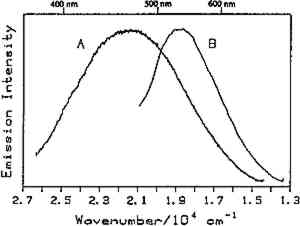 |
Fig. 8.
Luminescence spectra from manila copal (Dr. Hedenberg, 1920–23) on three different 100 micron regions of the same sample. The spectra were taken at romm temperature with 363.8 nm excitation.
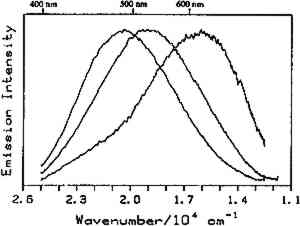 |
Fig. 9.
Luminescence spectra of: (A) dammar, (B) mastic, and (C) rosin at room temperature with 363.8 nm excitation
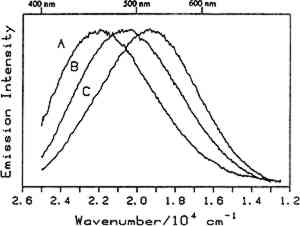 |
Fig. 10.
Luminescence spectra of bleached beeswax at (A) 295k, and (B) 25K. The excitation wavelength was 351.1 nm.
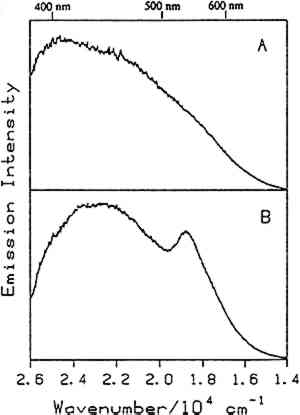 |
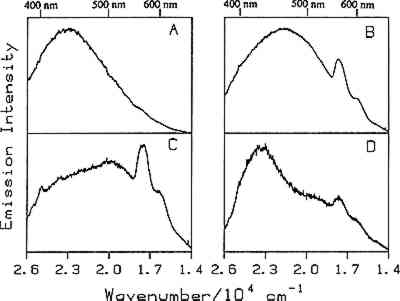
Fig. 11.
Comparison of low temperature (24K) luminescence spectra of bulk elemi (A) with films cast from solutions of (B) turpentine, (C) ethanol, and (D) mineral spirits. The excitation wavelength was 351.1 nm.
 |
|