PHOTOLUMINESCENCE SPECTROSCOPY OF NATURAL RESINS AND ORGANIC BINDING MEDIA OF PAINTINGSLONDA J. LARSON, KYEONG-SOOK KIM SHIN, & JEFFREY I. ZINK
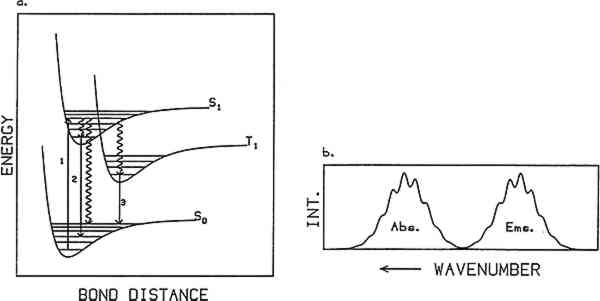
2 PHOTOLUMINESCENCE SPECTROSCOPYPHOTOLUMINESCENCE SPECTROSCOPY is based on the emission of light from matter following excitation by light absorption. Figure 1a illustrates a simplified energy state diagram depicting the process. Energy versus bond distance is plotted for the ground state and the two lowest excited states of a molecule. The curves labeled S0, S1, and T1 represent stable electronic energy states of the molecule. S0 is the ground electronic state, S1 the first excited singlet state, and T1 the first excited triplet state. Within each electronic energy state are a series of vibrational states represented by horizontal lines. The typical energy spacing between electronic energy states is in the ultraviolet and visible region of the electromagnetic spectrum (between 50,000 cm−1 and 12,500 cm−1 or
Absorption generally occurs from the lowest vibrational state of the ground electronic state. Typically the ground state is singlet in character (S0), that is, all electrons in the molecule have their spins paired, and from spin conservation rules absorption occurs into an excited singlet state (e.g., S1). Once a molecule is promoted to an excited electronic state it can follow one of three competing paths to release its excess internal energy: heat loss (radiationless decay), molecular decomposition (photochemical reaction), or radiative decay (luminescence). When relaxation occurs through heat loss, the molecule loses its excess energy through energy transfer to its surroundings. The loss of energy through molecular decomposition yields a new molecule. Radiative decay occurs when the molecule returns to its ground state by emitting a photon. Not all materials give measurable luminescence because the competitive relaxation pathways of radiationless decay or sample decomposition predominate. Emission usually occurs from the lowest vibrational state of the lowest excited electronic state of a given spin multiplicity. Thus after absorption takes place the molecule relaxes down to this level via energy transfer to its surroundings. This loss of energy is the reason an emission spectrum is at lower energy (i.e., longer wavelength) than the absorption spectrum for a particular molecule. When emission occurs from a singlet excited state to a singlet ground state, the phenomenon is called “fluorescence” and exhibits lifetimes on the order of nanoseconds (10−9 seconds) or less. If the molecule relaxes into an excited triplet state and then emits, the radiative phenomenon is called “phosphorescence.” This type of transition can have a lifetime ranging from milliseconds to seconds. While fluorescence may often be observed at room temperature, phosphorescence is usually observed only at low temperatures where the rates of the nonradiative decay processes are decreased. The generic term “luminescence” is used to refer to both of these radiative processes. A luminescence or emission spectrum is a plot of the intensity of light emitted as a function of wavelength or energy. Typical units are nanometers and wavenumbers (reciprocal wavelength in units of cm−1), respectively. The wavelength or wavenumber of maximum intensity and the full width at half maximum (fwhm) of an emission spectrum are important characteristics of the spectrum. If the vibrational bands in the ground state are resolved, the observed emission will show vibronic structure as illustrated in figure 1b. If the vibrational states are not resolved, the emission will be a broad envelope. Typically, the overall band shape for an emission spectrum of a pure molecular sample consists of a sharp rise in emission intensity on the high-energy (low-wavelength) side of the peak, with a more gradual decrease on the low-energy side. Different band shapes are often observed in spectra of samples that consist of more than one emitting component. In this case, the overall shape of the emission spectrum depends on the relative concentrations of the emitting species and their relative quantum yields. Additionally, a one-component sample rarely exhibits excitation wavelength-dependent emission because emission is observed only from the lowest excited state of a given spin multiplicity. In a multicomponent sample, however, different components may be excited selectively by varying the excitation wavelength, resulting in an excitation wavelength-dependent emission. Several features can characterize the luminescence spectrum from a sample. They are the fwhm of the spectrum, the shape of the spectrum, the wavelength (or wavenumber) of |