DETERMINATION OF THE SPECIFIC RATE CONSTANT FOR THE LOSS OF A YELLOW INTERMEDIATE DURING THE FADING OF ALIZARIN LAKERobert L. Feller, Ruth M. Johnston-Feller, & Catherine Bailie
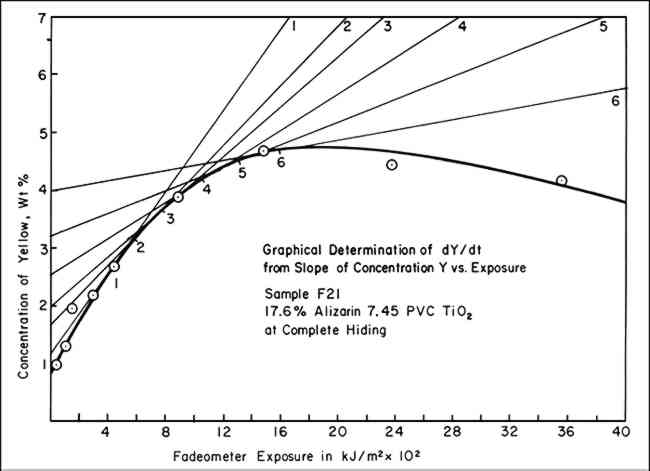
5 GRAPHICAL SOLUTIONS TO EQUATIONSIN ORDER TO UTILIZEequation vii, values of (dY/dt)/Y must be obtained. A graphical method can be used to provide this information. To accomplish this, the concentrations of the yellow component in the exposed panels, which the color-matching computations showed was required to match the faded state, were plotted on linear graph paper versus the exposure (t), expressed in terms of kiloJoules per square meter, kJ/m2, monitored at 420 nm. These data resulted in a series of points through which a smooth curve could be drawn showing the rise and subsequent fall in concentration of the yellow component, illustrated by the heavy-lined curve of Figure 3. By inspection, lines are drawn tangent to the curve at various points of tangency. The slope of these lines is dY/dt, the change in the concentration of Y per unit of
An example of the data necessary for preparing a graph such as that in Figure 3 is presented in Table I. Typical data, which we usually employed only for the calculated concentrations of yellow before it had reached its maximum concentration (at which point, incidently, the slope is zero), are shown in Figure 2. According to equation vi, the intercept on the ordinate axis of the line connecting these points is the value for k2 and should be negative. While the example here is for a sample made at complete hiding, the same procedure for obtaining k2 has been successfully applied to the data for samples at incomplete hiding. Table I Sample F21 Example of Data Used to Calculate k2 from Curve of Percent Yellow Versus Exposure |