DETERMINATION OF THE SPECIFIC RATE CONSTANT FOR THE LOSS OF A YELLOW INTERMEDIATE DURING THE FADING OF ALIZARIN LAKERobert L. Feller, Ruth M. Johnston-Feller, & Catherine Bailie
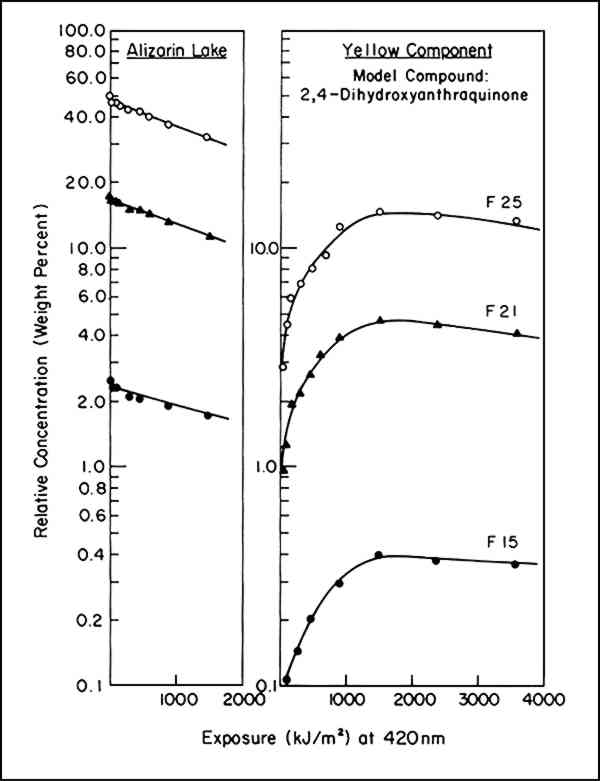
2 FIRST-ORDER RATE EQUATIONSANALYSIS OF THE DECLINE in the computed concentration of alizarin lake during exposure of these opaque mixtures of alizarin lake and titanium white revealed that, within the narrow zone in which fading took place, a constant fraction of the alizarin lake tended to be lost during any given period of exposure. The loss of a fixed fraction of the material present at any point in time corresponds to rate behavior known as first-order kinetics. This is expressed mathematically as
In the integrated form this becomes
Because the intensity of illumination diminishes with the age of the xenon lamps, instead of time we used the product of intensity times time, or exposure, for t. Thus, instead of reporting the fraction of alizarin lake lost per hour, the rate, in a sense, is expressed in terms of the fraction lost per footcandle hour or, in our case, per kiloJoule/cm2. The irradiance was monitored at a wavelength of 420 nm. As reported,2 the specific rate constant, k1, was found to be essentially constant throughout a range of initial concentrations of alizarin lake pigment of from 50 to 2.5% relative to the titanium white and a range of pigment volume concentration (PVC) of titanium white from 19 to 2.5%. This is indicated by the identical slopes of the plots of log A (equivalent to lnA/2.303) vs. exposure in Figure 1 regardless of initial concentration.
|