THE KINETICS OF FADING: OPAQUE PAINT FILMS PIGMENTED WITH ALIZARIN LAKE AND TITANIUM DIOXIDERuth Johnston-Feller, Robert L. Feller, Catherine W. Bailie, & Mary Curran
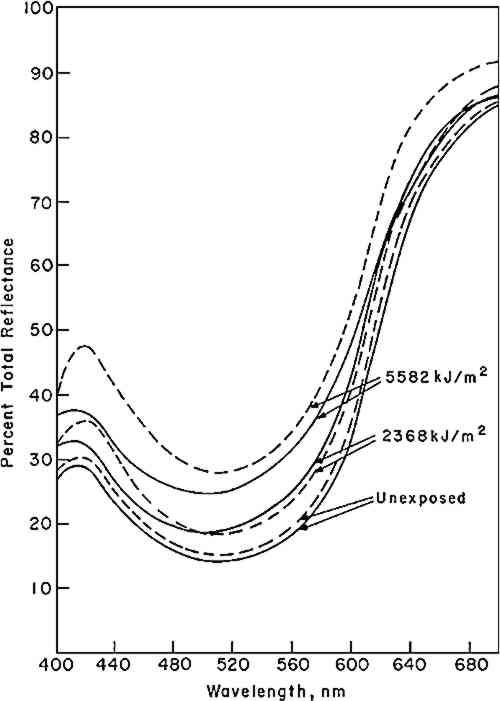
4 RESULTS4.1 KineticsOne of the first effects noted in our original study conducted in 1962–3—observed initially with alizarin added to a commercial flat alkyd-base paint and subsequently in a series of panels made with the acrylic emulsion, Rhoplex� AC-33 (Rohm and Haas Company, Philadelphia, Pa.)—was that the alizarin lake did not fade directly to a colorless form. Instead, a yellow intermediate was formed which, in turn, apparently faded to a colorless state. This behavior has been observed in all of our studies on the exposure of alizarin lake in mixture with a white pigment when the paint film was opaque (at complete hiding). Figure 1 illustrates some of the spectral curves
Kineticists frequently describe behavior such as this in terms of a series of consecutive chemical reactions as indicated by Equation vi,
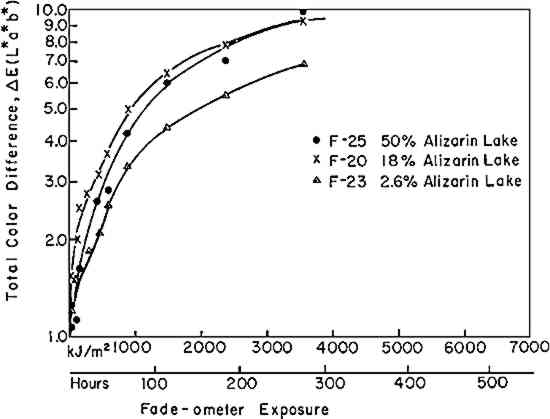
If the rate of fading of a colorant (alizarin lake in this case) follows a first-order rate law (Equation i), the experimenter may verify this by plotting the experimental data according to the integrated form of the equation (iia or iib); a graph of the logarithm of the concentration of the colorant versus the exposure will yield a straight line, the slope representing the specific rate constant, k1. Figure 3 shows the relative concentration of alizarin lake measured at various intervals of exposure, placed on a logarithmic scale, versus the exposure up to 1500 kJ/m2; the specific rate constants (the slopes) together with the 95% confidence interval, calculated from Equation iia by means of the least-squares solution, are given in Table II. Two facts become clear: first, regardless of the relative initial concentration of alizarin lake and regardless of the pigment volume concentration in the paints, the relationship is linear; second, within experimental error, the specific rate, k1, is constant over the considerable range of concentrations and PVC's employed. During the 1500 kJ/m2 period of exposure about one-third of the alizarin colorant had faded. In this length of time a control sample of the ISO R105 blue-wool fading standard No. 4, placed in the Fade-ometer� along with the alizarin panels, had faded to the extent of Geometric Grey Scale Contrast 3.13 Table II First Order Rate Constant for Fading of Alizarin, k1, in Vinac� B-7 at Complete Hiding The exposure of this set of panels was continued for almost 7000 kj/m2. The extended data are shown in Figure 4. The curves appear to have two first-order stages: that up to 1500 kJ/m2 and a slower stage after this period. In addition, an abrupt change took place initially in the first few hours of exposure. These two characteristics have been observed by previous authors.4,5,14,15 The break at 1500 kJ/m2 may be due to the more rapid fading of the smaller pigment particles, a fact long observed in the paint Further investigation will be necessary before a fully confident explanation of the apparent break in the curves can be provided. In many samples of this same paint system that we have prepared since these initial investigations, we have found no such sharp break. Figure 5 illustrates this behavior in a set of samples prepared several years The experimental results show that the specific rate of fading of the alizarin lake is, within experimental error and over a loss of between 30 and 70% of the initial concentration of lake, essentially independent of the relative concentration of alizarin lake, and of the pigment volume concentration (PVC). Thus, the pale tints did not lose The specific reaction rate for the fading of the yellow form, the k2 in Equation vi, was also determined for all samples; however, description of the complex mathematical technique used for calculating k2 will not be included here. The important conclusions are that k2 was found also to relate to a first-order reaction and that k2 was always larger than k1—that is, the specific rate of fading of the yellow intermediate is faster than the specific rate of concentration change of the red alizarin lake. 4.2 Visual Color ChangesMunsell notations were calculated for all the exposed samples in order that the color changes might be visualized by reference to the Munsell Book of Color. The Munsell data for one of the samples, mid-way in terms of relative alizarin lake-titanium dioxide concentration and pigment volume concentration, are presented in Table III. Table III Summary of Total Reflectance Measurements and Calculated Munsell Notations on Exposed Sample F-21 Color differences as the panels progressively faded from the original color were also calculated using the CIE 1976 L∗ a∗ b∗ equation. This equation expresses the total color difference, ΔE, as the square root of the sum of the squares for the lightness-darkness difference, ΔL∗, the redness-greenness difference, Δa∗, and the yellowness-blueness difference, Δb∗.12 One unit of ΔE (L∗a∗b∗) represents a good commercial color match; one-half unit of ΔE (L∗a∗b∗) is, on the average, a minimum perceptible difference. The calculated values of ΔL∗, Δa∗, and Δb∗ approximate the direction of the color shift and the ΔE represents the total color difference that the eye perceives. Figure 6 shows the total color difference, ΔE, plotted against the exposure for three samples, all at 2.5% PVC titanium dioxide, which contained 2.5%, 18%, and 50% alizarin lake by weight relative to the total dry pigment concentration. One would not be able to recognize first-order fading behavior from such data. Moreover, the midconcentration range, 18%, exhibited the highest color change, ΔE, up to about 3000 kJ/m2 exposure; the lowest net color change occurred in the case of the palest tint, 2.5% alizarin. These data additionally demonstrate the fact that for every pigment there is a range of relative pigment-white concentration for which the visual differences in color will be highest for a particular percentage loss in the concentration of colorant. Experience and theory reveals that the concentration of colorant which will exhibit the maximum ΔE (visual change) is one that will yield a reflectance of about 40% at the wavelength of absorption maximum.
|