THE BLISTERING OF PAPER DURING HYDROGEN PEROXIDE BLEACHINGDaniel Clement
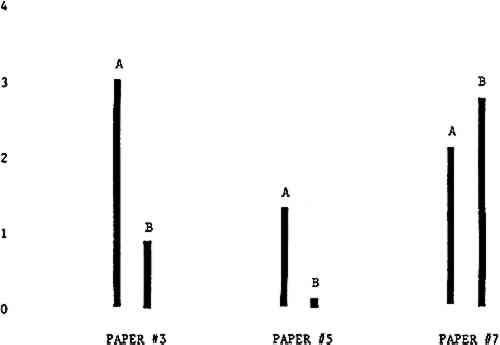
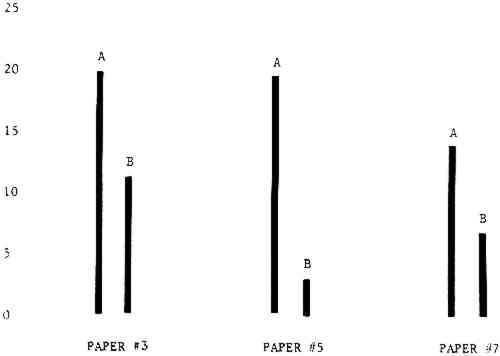
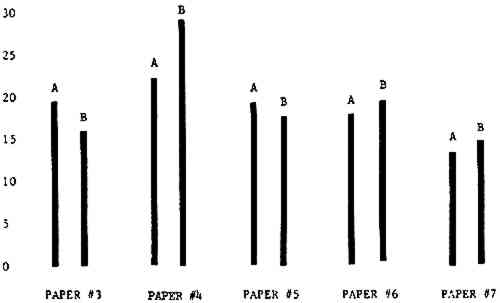
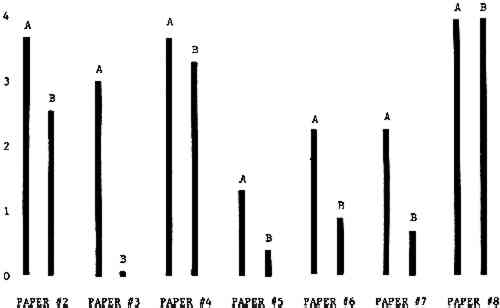
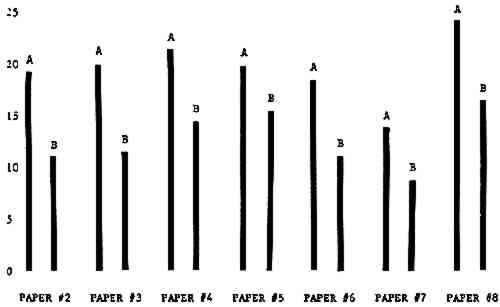
3 RESULTSData obtained in the experiment are summarized in the form of bar graphs (Figures 4–8). Each figure shows, for a number of different papers, the amount of bleaching and blistering that took place under the standard procedure as opposed to that which occurred under a modified procedure. The results obtained with each paper under the standard conditions are always represented by the bar (marked A) at the left in each pair of bars. The bar at the right (marked B) in each pair is the experimental variation which is being compared to the standard pH 10—2% procedure.
3.1 A. Calcium Hydroxide vs. Ammonia Pre-treatment
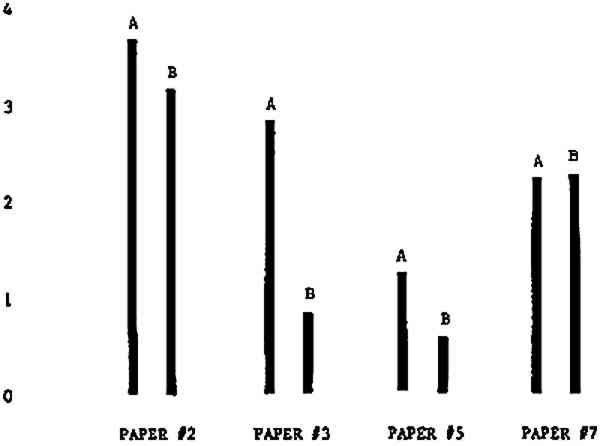
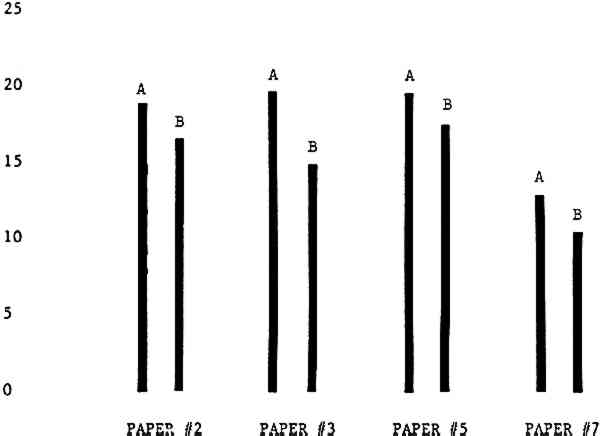
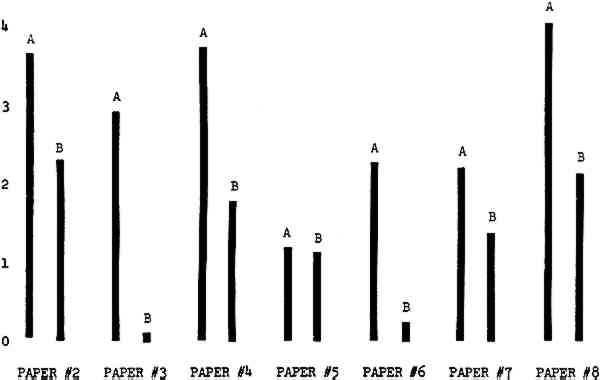
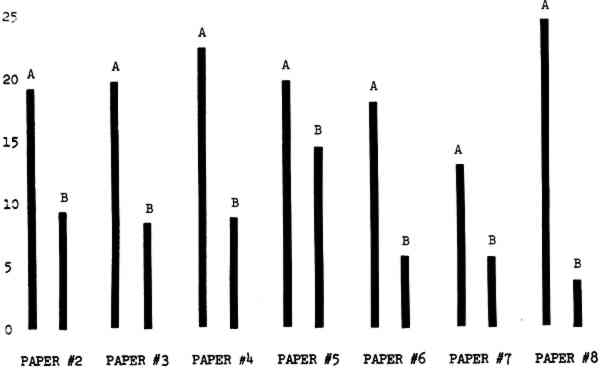
Figure 4A shows the amount of blistering that occured during bleaching and Figure 4B shows the increase in brightness. The amount of blistering was reduced in most, but not all cases. The amount of bleaching was slightly reduced in all cases, possibly because more discoloration was removed in pre-treatment due to the higher pH of the calcium hydroxide bath. 3.2 B. pH 9 vs. pH 10Figures 5A and 5B show that lowering the pH reduced both the amount of blistering and the amount of bleaching. This is consistent with the fact that the concentration of the active bleaching species and the rate of hydrogen peroxide decomposition are both less at lower pH. It is notable that the various papers reacted quite differently to the same variation in bleaching conditions. Blistering was reduced significantly with papers #3 and #4 without equally great reductions in bleaching. Little reduction in blistering occurred with paper #5. Although blistering was reduced significantly with paper #8, the reduction in bleaching was considered unacceptably great. The papers were obviously quite different in their reactions to changes in bleaching conditions, but the differences would probably not have been predictable by the paper conservator prior to bleaching. 3.3 C. 1% vs. 2% ConcentrationThe results given in Figures 6A and 6b show how three different papers reacted when the hydrogen peroxide concentration was lowered to 1% from the standard of 2%. With papers #3 and #5 blistering was substantially reduced, but not with paper #7. The amount of bleaching, however, was reduced in all cases. It is apparent that the amount of oxygen produced can be very substantial even with lower concentrations of hydrogen peroxide. The decomposition of even a small amount of hydrogen peroxide can produce a surprisingly large volume of oxygen. (The decomposition of 1 ml of a 1% solution can produce approximately 5 ml of gas.) 3.4 D. Stabilized vs. UnstabilizedFigures 7a and 7B show that with paper #3 the amount of blistering was greatly reduced while the amount of bleaching remained about the same. Unfortunately, such encouraging results were not produced with the other four papers. These results seem consistent with a statement by Schumb, Satterfield and Wentworth: “… it appears reasonably certain that in the presence of more than minute proportions of catalytically active contaminants it is impossible to restrain the decomposition of hydrogen peroxide by the addition of stabilizers …”15 It seems likely that the amount of impurities present in papers like these may be beyond the limit within which stabilizers are effective. It is worth noting that each time this bleach bath was prepared a certain amount of the white chemicals remained undissolved. This material clouded the solution and partially obstructed the view of the artwork. This phenomenon might restrict the usefulness of the bath for conservation procedures since the paper must be observed carefully during the bleaching process so that if blistering starts to occur the bleaching can be terminated. Also, the insoluble material might become trapped in the interstices of the paper. 3.5 E. Addition of EthanolIn the final variation of treatment, ethanol was added to the bleaching bath. It was hoped that in the presence of ethanol the paper might remain stronger because of the smaller percentage of water. Ethanol reduces the surface tension, thus increasing the possibility that the gas produced could escape from the paper structure without damaging the paper. Oxygen is also much more soluble in ethanol than in water, a fact which might reduce the extent of bubble formation. Figure 8A shows that the addition of ethanol reduced the amount of blistering in most but not all cases. Again, the various papers reacted to the same change in procedure quite differently. The addition of ethanol practically eliminated the blistering with paper #3, but did not substantially reduce the blistering with papers #4 and #8. Blistering was quite reduced also with papers #5, #6 and #7. The amount of bleaching was reduced in all cases. 3.6 F. Marginal PiecesAs mentioned earlier, note was made of which pieces came from the margins of the prints and these pieces were distributed among the different bleaching baths. Indeed, it was found that the amount of blistering on these pieces was greater than average by about half a point in the 0 to 4 scale used to describe damage. 3.7 G. Alkaline Wash ControlsThe amount of brightening due to alkalinity alone was always very small compared to the effect due to bleaching.16 3.8 H. pH Changes During BleachingThe alkalinity of the bleaching baths never changed by more than 0.15 pH unit during treatment, and generally the changes were much less than this. These fluctuations were judged not to be significant. |