THE FEASIBILITY OF USING THERMOGRAPHY TO DETECT SUBSURFACE VOIDS IN PAINTED WOODEN PANELSBRUCE F. MILLER
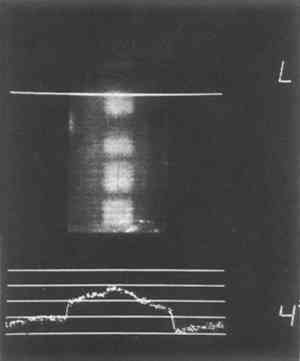
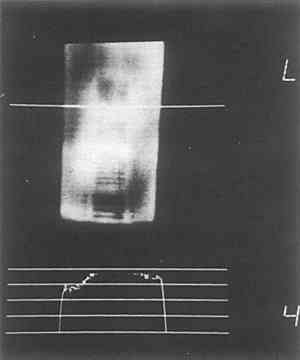
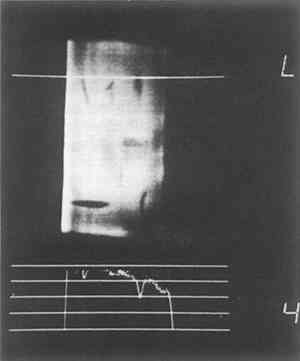
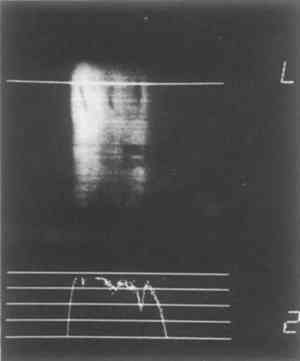
2 THE THEORETICAL BASIS FOR THERMOGRAPHYThe thermographic detection of voids within solid structures is based on one simple principle. This principle is that the thermal coefficient of air is less than the thermal coefficients of wood and paint. Because air has a very low thermal conductivity, it has the ability to restrict the flow of heat. Because voids within panel paintings contain air, these voids can be expected to have insulating properties. The insulating effect of voids within solid substances can be illustrated by considering the following model: the heating of a metal bar that has a slot cut near its front surface and penetrating from one side of the bar to the other. This slot constitutes a void within the otherwise solid composition of the bar. If the front surface of the bar were evenly heated, heat would immediately begin to penetrate the bar and travel toward the back surface. The air within the slot, however, would locally restrict the flow of heat. The result would be that the front surface of the bar over the slot would retain its heat longer than the surrounding surface that is in contact with a relatively large mass of metal acting as a heat sink. By measuring the temperature across the whole front surface of this bar the location of the slot could be established. There are several methods of creating conditions by which temperature variations over subsurface voids can be produced. The back surface of an object rather than the front surface can be heated. Either the front or back surface can be cooled rather than heated, or any combination of these methods could be used. When dealing with art objects, however, any technique that requires marked changes in temperature is out of the question. The fact that voids have the capacity to induce temperature variations on surfaces would be useless if no means for detecting these variations existed. Although there are many instruments capable of measuring heat, few of these devices are suitable for void detection techniques. Although contact thermometers such as liquid in glass thermometers and thermocouples can be extremely sensitive and accurate, they are slow to react and difficult to read. It is also difficult to obtain an accurate temperature measurement of a small object with a contact thermometer because its mass (even the small mass of a thermocouple) often overwhelms the mass of the object being measured.2 This would be the case with unsupported paint films that have very low masses. It is also difficult if not impossible to simultaneously measure the temperature of many points on a two-dimensional surface with contact thermometers. Therefore, although contact thermometers are inexpensive and readily available, they are unsuitable for void detection techniques. Because of the unsuitability of contact thermometers, a remote temperature-sensing device was used for this research. The instrument used was a raster scanning radiometer. Raster scanning radiometers are similar to television cameras in that they optically scan two- or three-dimensional objects placed in front of them and produce two-dimensional images of these objects on a cathode ray tube (CRT). Whereas television cameras sense the visible light reflected by the object viewed, radiometers sense the infrared radiation emitted by the object. All matter with a temperature above absolute zero (−273�C) emits infrared radiation and because the intensity and wavelength of this infrared radiation is directly proportional to its temperature,3 the record of the emitted infrared radiation produced on the CRT of the radiometer can be directly translated into the temperature of the object. Radiometers are used in industry to measure minute temperature variations in electronic circuits, to detect voids in cast ceramic or metallic objects, and to detect disbonds in laminated structures. In medicine, radiometers are used to detect the minute local changes in body temperature caused by tumors and obstructions in arteries. The device used in the well-known research of J.R.J. van Asperen de Boer in which he studied underdrawings in paintings was done with a slightly modified infrared radiometer.4 The radiometer used for this research was a Spectrotherm Model 800 medical radiometer.5 The instrument was situated at St. Vincent's Hospital in Toledo, Ohio. This radiometer was sensitive enough to detect temperature variations as small as 0.2�C. The image produced by this radiometer is called a thermogram. Several thermograms, which in this case are Polaroid� photographs of the radiometer's display, are reproduced in Figures 1a through 1d. Each thermogram is an image of a painted wood panel constructed for this research. The light areas on the thermograms represent hot areas on the panels while the dark areas represent cooler areas. The graphs on the bottom of each photograph are graphs of the temperature variation across the image area beneath the fiducial marker, which can be set by the machine's operator to measure the temperature of any horizontal line in the image area. The horizontal axis of the graph represents the location of any thermal variation and the vertical axis represents the relative temperature of the area. The span of temperature measured by the instrument and represented by the graph can be adjusted; the chosen setting is recorded in the lower right corner of each thermogram. The “4�” setting means that from the top line to the bottom line on the graph, a temperature span of 4�C is represented, therefore, each line corresponds to 1�C. The “2�” setting means that each line represents 0.5�C. Thus each thermogram produced by this instrument contains not only a thermal “picture” of the object being measured, but also a graph of the temperature along a horizontal strip of the object providing more precise but still relative temperature measurements of the object.
|