OPTICAL BRIGHTENING AGENTS IN PHOTOGRAPHIC PAPERPaul Messier, Valerie Baas, Diane Tafilowski, & Lauren Varga
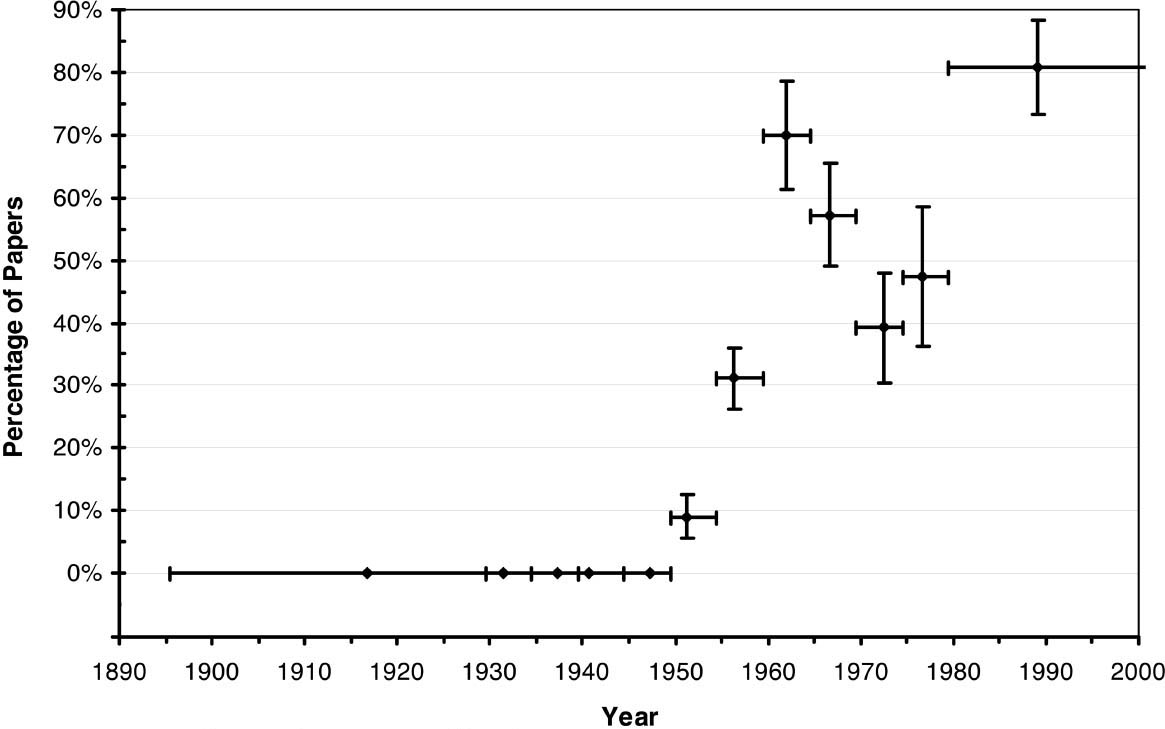
3 RESULTS3.1 OBSERVATIONSResults for individual papers were grouped by date. Grouping the data over a span of five or more years was considered necessary to account for the inability to assign absolutely precise manufacture dates as described in section 2.2. Table 1 presents the groupings, date ranges, number of samples assessed, and number and percentage of samples showing optical brightening agents. Figure 4 presents a plot of these data. 3.2 ANALYSIS AND INTERPRETATIONAs stated in section 2, the photographic papers used for this study were purchased almost entirely from Internet auction sites. This collecting method relies exclusively on chance availability of one or two lots at a time coming from individual sellers located
Assuming a valid random sampling and allowing for some statistical uncertainty, the results of the survey can reasonably be applied to the population of papers produced over the last 100 years. The number of samples assessed dictates the level of statistical uncertainty. In addition to presenting the data in table 1, most points in figure 4 have a Y-axis error bar that shows how data from this study represent the entire population of papers at a 95% confidence interval. The confidence intervals were determined by the
where efficiency e is the number between 0 and 1 measuring the probability of a sample randomly selected inside the given time interval containing optical brightening agents, n_OBA is the number of samples with optical brightening agents, and n_total is the total number of samples in the specified time interval, and
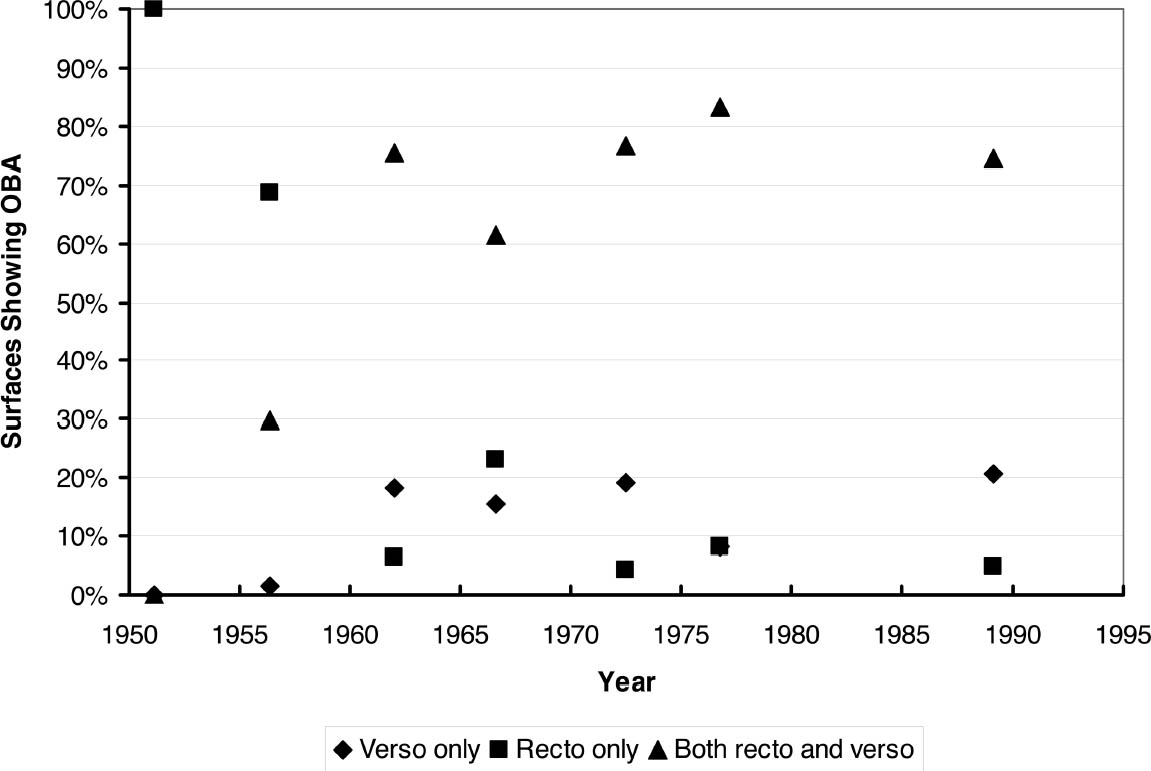
where sigma_e is the statistical error on the efficiency (or the error resulting from the fact that not all papers produced in a given year were sampled). X-axis bars at each point show the date range covered for each group of samples. Within each date range, the diamond-shaped data points are placed at the average date for the samples. As shown in table 1 and figure 4, no optical brightening agents were found in the 652 samples dating from 1895 to 1949. The earliest finding of optical brightening agent was in the period 1950 to 1954. In this early period, 9% of samples showed optical brightening agents. The percentage of papers with optical brightening agents increased rapidly after 1955, with a peak occurrence rate of 70% between 1960 and 1964. Occurrences of optical brightening agents declined in the period between 1965 and 1979 to a low point of 39%, then increased after 1980 to 81%. As stated in section 2.3, whenever possible, samples were examined on both the recto (emulsion) and verso (paper base) for the presence of optical brightening agents. Figure 5 shows the distribution of occurrences based on surface(s) showing optical brightening agents. Only papers where both recto and verso were accessible (eliminating mounted photographs) are included in the chart.
As shown in the figure 5, brighteners were found almost exclusively in the emulsion side between 1950 and 1960. After this early period, brighteners predominantly were found on both surfaces at levels ranging from 62% to 83% of all occurrences. |