IDENTIFICATION OF THE PRE-COLUMBIAN PIGMENT MAYA BLUE ON WORKS OF ART BY NONINVASIVE UV-VIS AND RAMAN SPECTROSCOPIC TECHNIQUESMARCO LEONA, FRANCESCA CASADIO, MAURO BACCI, & MARCELLO PICOLLO
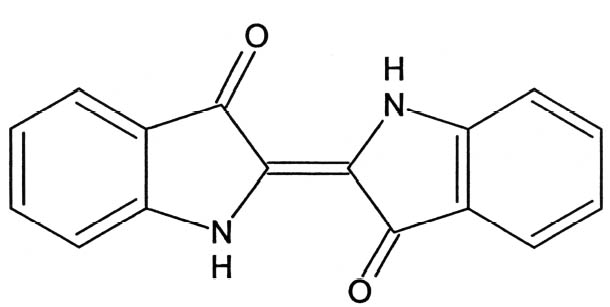
ABSTRACT—UV-visible reflectance spectroscopy and Raman microspectroscopy provide a rapid way to unequivocally identify the pre-Columbian pigment Maya blue. Spectra of modern synthetic materials are compared with data from a contextualized archaeological sample and from an object in the collection of the Los Angeles County Museum of Art. UV-visible spectroscopy and Raman microspectroscopy, together with complementary techniques such as Fourier transform infrared microspectroscopy, reveal significant differences between spectra of indigo as pure crystalline solid or as complexed by palygorskite. These techniques are thus extremely specific, being able to identify Maya blue as a prepared pigment rather than detecting only its ingredients, indigo and palygorskite. Fiber optics UV-visible reflectance spectroscopy and Raman microspectroscopy present the additional advantage of being completely noninvasive and therefore suitable for the study of works of art. Lightweight portable fiber optics UV-visible reflectance spectroscopy devices make it possible to perform measurements in situ on wall paintings and other immovable objects. The spectral differences between pure indigo and the indigo-palygorskite complex can be interpreted in terms of different hydrogen bonding configurations for the indigo molecule. TITRE—Identification du pigment pr�colombien bleu Maya sur les œuvres d'art par des techniques non envahissantes de spectroscopie UV-visible et Raman. R�SUM�—La spectroscopie UV-visible de r�flectance et la micro-spectroscopie Raman fournissent une mani�re rapide d'identifier sans �quivoque le pigment pr�colombien bleu Maya. Les spectres de mat�riaux synth�tiques modernes sont compar�s aux donn�es d'un �chantillon arch�ologique d'origine connue et d'un objet dans la collection du Los Angeles County Museum of Art (mus�e d'art du comt� de Los Angeles). La spectroscopie UV-visible et la micro-spectroscopie Raman, ainsi que des techniques compl�mentaires telles que la micro-spectroscopie infrarouge � transform�e de Fourier, indiquent des diff�rences significatives entre les spectres de l'indigo pur solide cristallin et l'indigo m�lang� avec de la palygorskite. Ces techniques sont ainsi extr�mement sp�cifiques, permettant d'identifier le bleu Maya en temps que pigment � part enti�re, au lieu de d�tecter s�par�ment ses composants, l'indigo et la palygorskite. La spectroscopie UV-visible � fibres optiques et la micro-spectroscopie Raman pr�sentent l'avantage additionnel d'�tre compl�tement non envahissantes et donc appropri�es � l'�tude des œuvres d'art. Des dispositifs portatifs l�gers de spectroscopic UV-visible � fibres optiques permettent d'effectuer des mesures in situ sur les peintures murales et autres objets inamovibles. Les diff�rences spectrales entre l'indigo pur et le complexe indigo-palygorskite peuvent �tre interpr�t�es en termes de diff�rentes configurations de la liaison hydrog�ne pour la mol�cule d'indigo. TITULO—Identificaci�n del pigmento azul Maya en obras de arte con t�cnicas UV-vis no invasivas y t�cnicas espectrosc�picas Raman. RESUMEN—La espectroscop�a de reflectancia UV-visible y la microspectroscop�a Raman proporcionan una manera r�pida de identificar inequ�vocamente el pigmento precolombino Maya azul. Se comparan espectros de materiales sint�ticos modernos con datos de una muestra arqueol�gica contextualizada y con un objeto de la colecci�n del Los Angeles County Museum of Art (Museo de Arte del Condado de Los Angeles). La espectroscop�a UV-visible y la microspectroscop�a Raman, junto con t�cnicas complementarias como la microspectroscop�a infrarroja con transformadores de Fourier, revelan significativas diferencias entre los espectros del �ndigo como s�lido puro cristalino o como complejo con palygorskita. De manera que estas t�cnicas son extremadamente espec�ficas, y pueden identificar el azul Maya como un pigmento preparado en lugar de detectar solamente sus ingredientes, �ndigo y palygorskita. La espectroscop�a de reflectancia UV-visible de fibras �pticas y la microspectroscop�a Raman presentan la ventaja adicional de ser TITULO—Identifica��o do pigmento pr�colombiano azul Maya em obras de arte atrav�s das t�cnicas n�o invasivas UV-Vis�vel e espectroscopia Raman. RESUMO—A espectroscopia por reflect�ncia no UV-vis�vel e a microespectroscopia Raman fornecem um meio r�pido para identificar, inequivocamente, o pigmento pr�-colombiano azul Maya. Espectros de materiais sint�ticos modernos s�o comparados com dados de uma amostra arqueol�gica contextualizada e de um objeto da cole��o do Los Angeles County Museum of Art (Museu de Arte do Condado de Los Angeles). A espectroscopia UV-vis�vel e a microespectroscopia Raman, juntamente com outras t�cnicas complementares, tais como a espectroscopia de infravermelho com transformada de Fourier, revelam diferen�as significativas entre espectro de �ndigo como s�lido cristalino puro ou como complexo palygorskite. Deste modo, essas t�cnicas s�o extremamente espec�ficas, sendo capazes de identificar azul Maya como um pigmento preparado, ao inv�s de detectar somente seus ingredientes �ndigo e palygorskite. A espectroscopia por reflect�ncia no UV-vis�vel e a microespectroscopia Raman apresentam uma vantagem adicional por serem completamente n�oinvasivas e, por conseguinte, adequadas ao estudo de obras de arte. O uso de aparelhos port�teis leves de fibra �tica UV-vis�vel possibilita a realiza��o de medi��es in situ em pinturas murais ou outros objetos que n�o podem ser movidos. As diferen�as de espectro entre o �ndigo puro e o complexo �ndigo-palygorskite podem ser interpretadas em termos de diferentes configura��es de liga��es de hidrog�nio para a mol�cula de �ndigo. 1 INTRODUCTIONSince its rediscovery in 1931 (Merwin 1931), Maya blue has been the object of persistent attempts to unravel its composition and explain its extraordinary stability and colorfastness (Littmann 1980, 1982; Roundhill et al. 1989). While the nature of Maya blue as a complex of indigo and palygorskite had been established by the late 1960s (Gettens 1962; Shepard and Gottlieb 1962; Van Olphen 1966), significant advances in the elucidation of its structure have only recently been made (Polette et al. 2002; Chiari et al. 2003). According to the most recent models, indigo molecules (fig. 1) are hosted in the zeolitic channels of palygorskite crystals (Polette et al. 2002; Chiari et al. 2003), where they engage in hydrogen bonds with the hydroxyl groups of the clay. Palygorskite, whose general formula is (Mg, Al)4Si8 (O, OH, H2O)24�nH2O, is a layer silicate containing ribbon strips of SiO4 tetrahedra and (Mg, Al)O6 octahedra. The ribbons are arranged in such a way as to define channels, which contain water molecules. The structure of palygorskite is too complex to be efficiently depicted here, and the reader should see the above-mentioned references for further information. Early investigations into the nature of Maya blue were based on techniques such as polarized light microscopy (PLM), microchemical tests, determination of elemental composition, or x-ray diffraction (XRD). Of these methods, only the microchemical test with concentrated nitric acid (HNO3) can be described as a specific test for Maya blue, since the persistence of the blue color even after attack with the strong oxidizer is a unique result of the formation of the indigo-palygorskite complex. The other methods
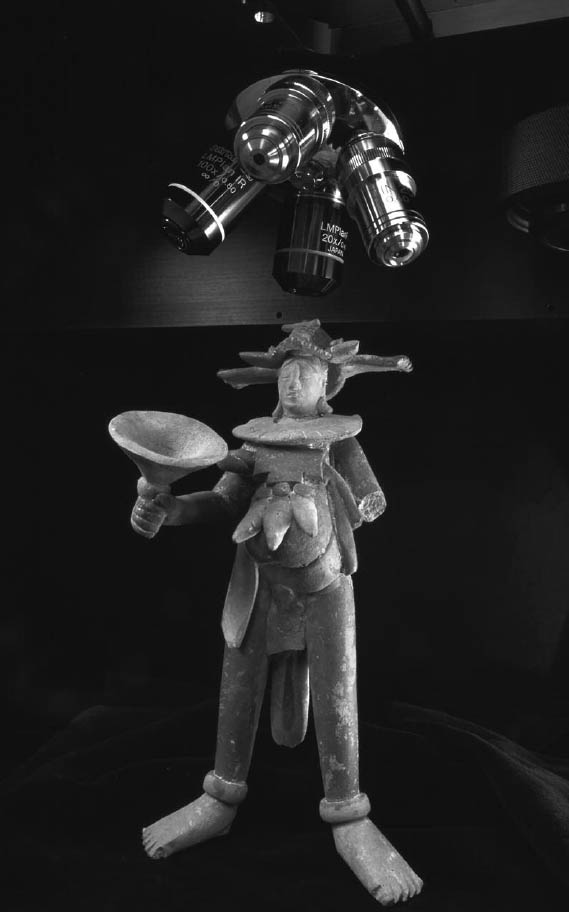
Infrared spectroscopic techniques were later applied to the study of Maya blue with a slightly greater degree of success, due to the possibility of identifying both the inorganic and organic components of the pigment at once, with good sensitivity. However, to date, the only infrared spectra of Maya blue published in the literature are those by Kleber et al. (1967) and by Palacios-Lazcano and Reyes-Valerio (1993). The former, obtained with instrumentation dating back to the late 1960s, are characterized by a rather poor signal-to-noise ratio (S/N), especially in diagnostically significant areas such as the region of wavenumber range 1700–1250 cm-1, and show dominant signals of the inorganic matrix and weak peaks for indigo. The latter, obtained mainly on archaeological samples, contain intense bands due to the clay but also to other contaminants or constituents of the original painting layers such as calcite or gypsum, often completely obscuring the absorption peaks of indigo. More recently, techniques such as transmission electron microscopy (Magaloni et al. 1991; Yacam�n and Serra Puche 1995; Yacam�n et al. 1996; Spoto et al. 2000; Polette et al. 2002), scanning electron microscopy (Polette et al. 1998; Chiari 2001), synchroton x-ray diffraction (Chiari et al. 2003), and luminescence spectroscopy (Aj� et al. 1996; Chiari et al. 1999) have been applied to the study of Maya blue. Electronic and vibrational spectroscopic techniques have so far seen only limited use (Kleber et al. 1967; Palacios-Lazcano and Reyes-Valerio 1993; Grimaldi 2000), in spite of their ability to unequivocally identify the pigment on archaeological samples without the need for sampling and their potential to discriminate Maya blue from simple indigo. Additionally, these techniques are, for different reasons, extremely sensitive to Maya blue. As discussed earlier, detection of indigo in Maya blue by XRD and Fourier transform infrared microspectroscopy (FTIR) is hampered by the small concentration of the dyestuff and by the interfering effect of the clay. The fact that organic colorants, when used as pigments or textile dyes, are always found in extremely low concentrations is an intrinsic problem in the analysis of dyestuffs. To be economically useful, a dye has to have a rather large extinction coefficient; that is, it must impart a strong coloration even when used in small quantities. FTIR and even gas chromatography–mass spectrometry are thus poor techniques for detecting indigo in works of art (Leona 1999), since the analytical signals from indigo are dwarfed by the interfering effect of the other components (binding media, extenders, fragments of the support, or even consolidants, as is often the case with wall paintings and museum objects). UV-visible spectroscopy, compared to the other techniques, uniquely exploits the one physical property of the pigment not shared by extenders and binding media: its electronic spectrum is characterized by absorption in the visible range—color. Raman microspectroscopy can be equally sensitive: Raman peaks are usually sharper than IR bands, and inorganic components may interfere less with the characteristic spectral features of the dye than in FTIR spectroscopy, particularly if the exciting frequency is properly selected (Clark 1995; Cariati and Bruni 2000). In the present study, fiber optics UV-Vis reflectance spectroscopy (FORS) instrumentation and methodologies (Bacci et al. 1992; Bacci and Picollo 1996; Bacci 2000), previously developed for the noninvasive identification of indigo on Japanese paintings of the Edo period (Leona and Winter 2001), were applied in the analysis of an archaeological sample of Maya blue from the excavation of the Templo Mayor in Mexico City (Grimaldi 2000) and, noninvasively, in the examination of a Jaina painted pottery figurine from the collection of the Los Angeles County Museum of Art (LACMA). Raman microspectroscopy (RM), initially explored by Rintoul (Grimaldi 2000) and Guineau (1987), was also successfully employed to identify the pigment in
2 MATERIALS AND METHODS2.1 REFERENCE MATERIALSSynthetic indigo was obtained from Aldrich (22,929-6; Indigo, synthetic, dye content approx. 95%) and Janssen (21.213.67, Indigo, synthetic). Palygorskite clay from Gadsden County, Florida (commonly called attapulgite in the United States), was obtained through the University of Missouri–Columbia Source Clay Minerals Repository, Columbia, Missouri. Maya blue was prepared according to a procedure derived from procedures available in the literature (Van Olphen 1966; Littmann 1982). The starting materials for the synthesis of the pigment consisted of 0.1 g of indigo and 5 g of palygorskite, mixed and then thoroughly 2.2 ARCHAEOLOGICAL SAMPLESSpectra of Maya blue of pre-Columbian origin were obtained from a fragment of a wall painting from the Templo Mayor in Mexico City, Mexico (Sample 31, Tlaloc Shrine, Construction Stage II, A.D. 1375–1427 [Grimaldi 2000, 104]) and, noninvasively, from a Jaina statuette from LACMA's collection (M.76.157, Mexico, Campeche, Jaina, A.D. 700–900) (see fig. 2). 2.3 ANALYTICAL TECHNIQUES2.3.1 UV-Visible –Near InfraredThe powders of pure indigo, palygorskite, and Maya blue, as well as a set of mixtures made with indigo and barium sulfate, were analyzed using a Perkin-Elmer λ19 spectrophotometer equipped with a 60 mm integrating sphere. The diffuse reflectance spectra were acquired from 320 to 2500 nm, step 1 nm. The resolution of the spectrophotometer was �0.2 nm and �0.8 nm for the UV-Vis and near infrared (NIR) ranges, respectively. Calibration was performed by means of barium sulfate (BaSO4) powder. 2.3.2 Fiber Optics UV-Visible Reflectance SpectroscopyFORS spectra were recorded with a CARY 50 UV-visible spectrophotometer, equipped with a fiber optic probe manufactured by Innovaquartz (Phoenix, Ariz.). The probe was specifically designed to provide extended transmission in the UV range, enhanced energy throughput, and an analytical spot of 1 mm in diameter at a working distance of 2 mm. The probe consists of a bundle containing one central 800 μm core diameter high-OH silica fiber, surrounded by eight 600 μm core diameter high-OH silica fibers, partially fused to increase the packing fraction and ground and polished to form a focusing lens. The central fiber was connected to the source port of the instrument (a scanning monochromator and a xenon flashlamp), and the eight peripheral fibers were connected to the detector port (a silicon photodiode). Spectra were recorded over the 200–800 nm spectral range, with dwell time 0.5 seconds and step size 2 nm; the spectra were smoothed using a Savitzky-Golay filter (filter size 9 points, interval 2 points). Baseline spectra were obtained from Spectralon 99% diffuse reflectance reference material. Additionally, to test the feasibility of using a lightweight portable FORS instrument to analyze archaeological objects in situ, FORS spectra on modern Maya blue were also recorded with a Zeiss MC501 spectrophotometer in the 300–860 nm (0.8 nm/pixel resolution) range using Spectralon 99% diffuse reflectance standard for calibration. 2.3.3 Raman MicrospectroscopyRaman spectra were recorded on a Chromex Senturion Raman microscope equipped with a 70 mW 785 nm laser diode. Spectra were recorded between 150 and 1650 cm-1 using a 1200 rulings/mm holographic grating. Spectral calibration was achieved using the proprietary system Sure_Cal (Allen et al. 2000). Raman spectra of Maya blue were recorded both conventionally and employing a new technique for the rejection of fluorescence. The technique is based on the acquisition of Raman spectra at 2.3.4 Fourier Transform Infrared MicrospectroscopySamples were compressed in a diamond anvil cell (Spectra Tech) and analyzed between 4000 and 700 cm-1 with a Thermo-Nicolet Nexus infrared spectrophotometer equipped with a liquid nitrogen–cooled MCT detector and an Olympus Continuum optical microscope. Spectra were collected as the sum of 256 scans at 4 cm-1 resolution. Aperture dimensions could be varied to limit the target area to a minimum of approximately 10 x 10 μm, thus achieving a very high degree of selectivity. 3 RESULTS AND DISCUSSIONSpectroscopic investigation of samples of indigo, palygorskite, and Maya blue disclosed valuable information for their unambiguous differentiation and provided additional elements for further characterization of the pre-Columbian pigment. It is important to note that modern Maya blue and Maya blue from archaeological samples produced identical spectra with all techniques. The NIR is the only region in which no significant information concerning Maya
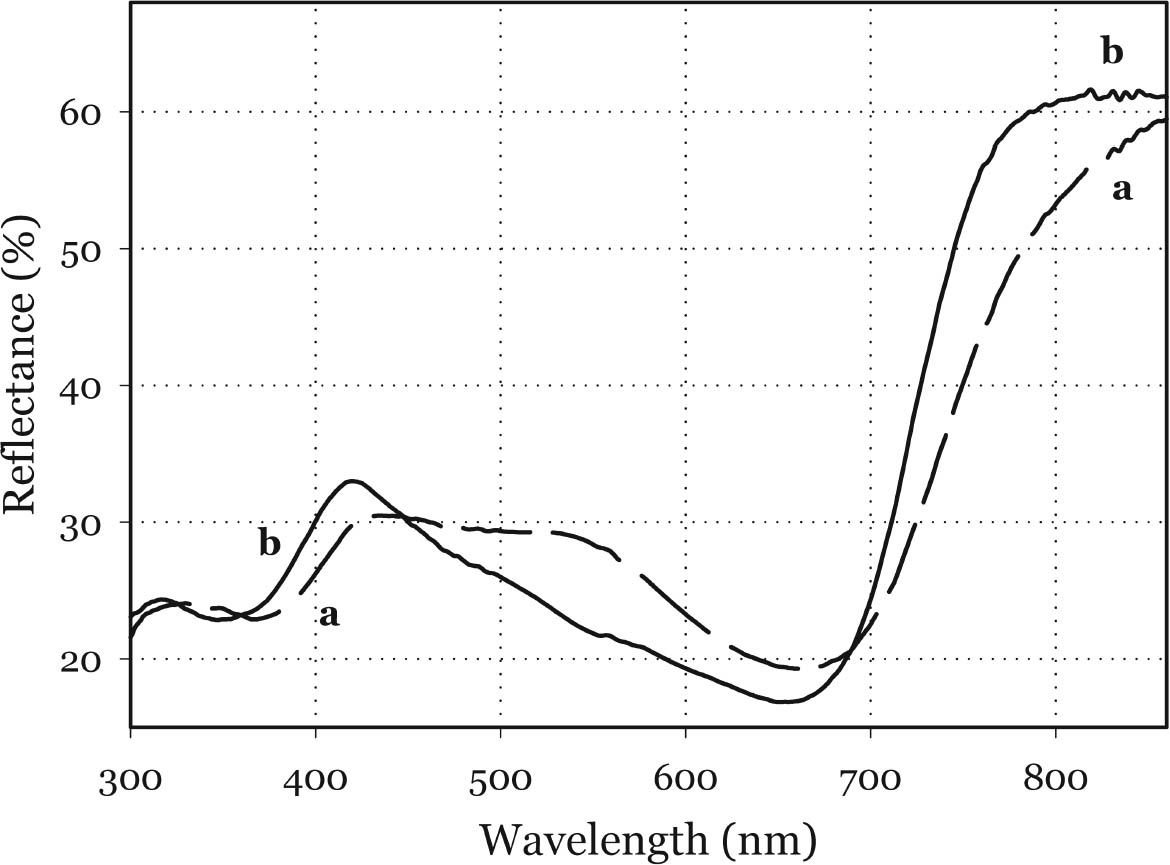
3.1 NIR REFLECTANCE SPECTROSCOPY AND UV-VISIBLE FIBER OPTICS REFLECTANCE SPECTROSCOPYNIR reflectance spectroscopy does not show any significant differences between Maya blue and palygorskite. In fact, the spectral features of palygorskite mask any other absorption peak, apart from a slight inflection at about 1700 nm, probably due to the first overtone of the C-H stretching (Bacci 2000). The visible spectra of indigo, as pure powder, mixed with an inert material (barium sulfate), or in a painted layer in actual works of art (Bacci et al. 1995; Aldrovandi et al. 1997; Miliani et al. 1998), differ substantially from those of indigo in Maya blue. As shown in figure 4, indigo is characterized by a broad and asymmetric band in the 420–730 nm range. The peak of the absorption band can be best appreciated when indigo is dispersed into an inert material: in such a case the peak is found at about 660 nm (indigo concentration below 9%). Indigo in Maya blue displays a narrower and more prominent band in the 540–730 nm range, the peak of which is slightly
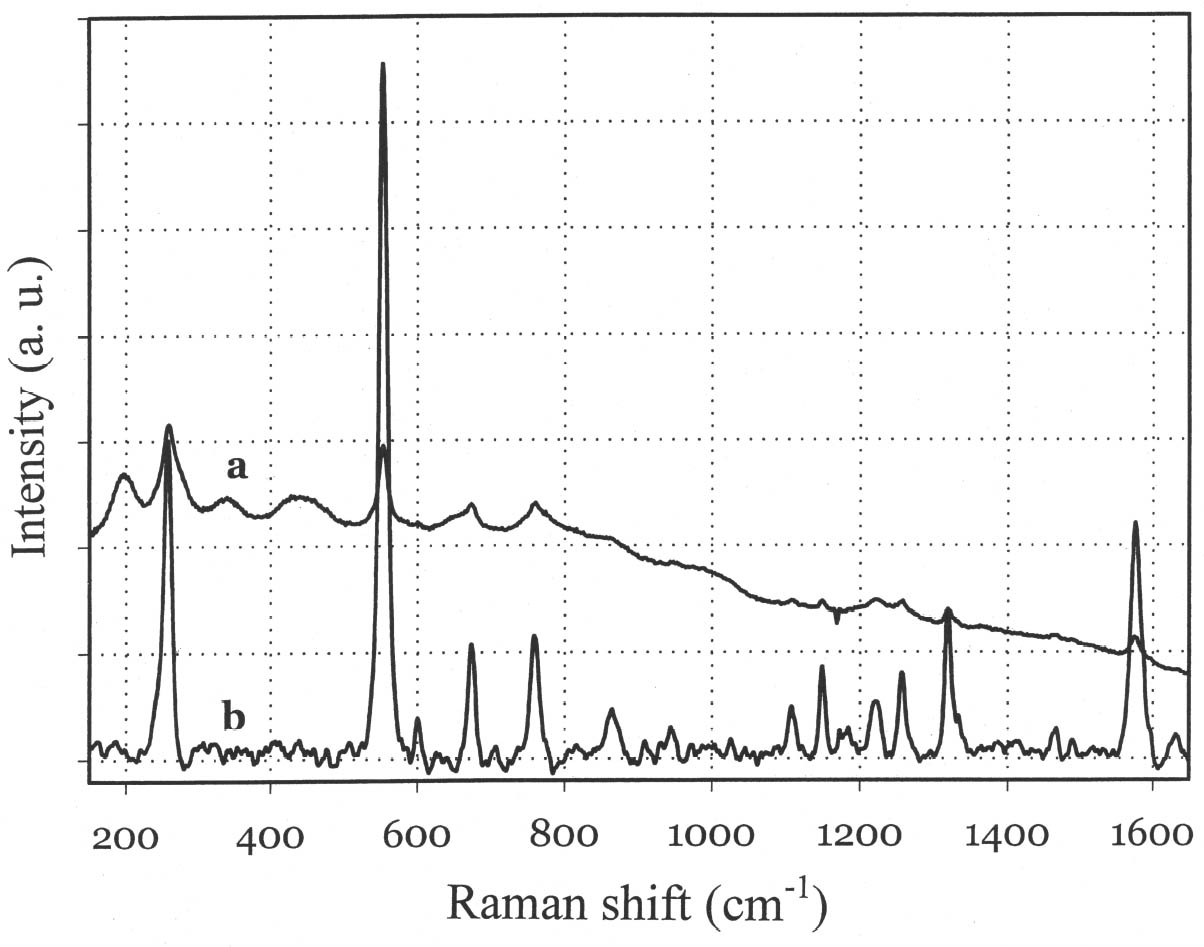
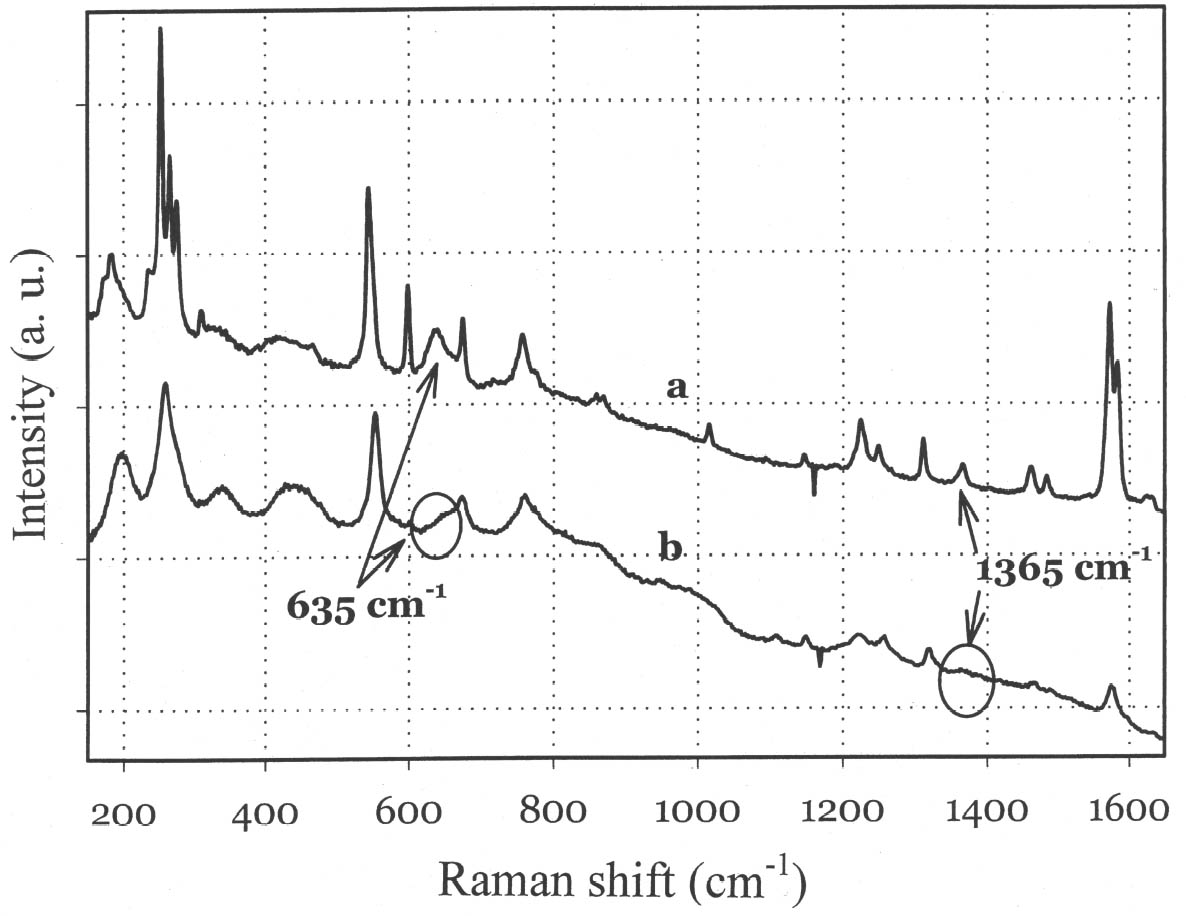
Although the UV-Vis spectrum lacks the fingerprinting detail characteristic of vibrational molecular spectra (Raman and FTIR, discussed in the following paragraphs), the absorption maximum in the visible range and the actual curve profile allow differentiation of Maya blue from the pure indigo dye. The differences observed between the spectra of Maya blue and indigo arise from differences in the chemical environment for indigo molecules in the pure solid and adsorbed on palygorskite. The absorption band observed in the UV-visible spectrum at 420–730 nm corresponds to the lowest energy π-π* electronic transition, from the highest occupied molecular orbital (HOMO) to the lowest unoccupied molecular orbital (LUMO). This transition is strongly influenced by conditions such as aggregation state (vapor, amorphous solid, crystalline solid), solvation (more or less polar solvent may stabilize the ground state or the excited state of the molecule, leading to a shift in absorption wavelength), and pH. It is well known that indigo shows a strong solvatochromism (solvent-dependent color shift), confirming the strong influence that interand intramolecular bonding exert on the light-absorption properties of this molecule. In particular, it has been shown (Monahan and Kuder 1972; Serrano-Andr�s and Roos 1997) that in passing from vapor phase to nonpolar solvents and, successively, to polar solvents, the π-π* band is red-shifted; that is, the HOMO and LUMO levels move closer. It is likely that intramolecular H-bonds are favored in nonpolar solvents with a subsequent formation of indigo aggregates, whereas H-bonds with the solvent molecules are more probable in polar solvents. In the latter case there is a loosening of the N-H bond, which makes possible a withdrawal of electrons from the nitrogen atom and the carbon atoms of the O=C–C=C–C=O chain toward the hydrogen atom, thus resulting in a redistribution of electron charge. Pure indigo and indigo in Maya blue compare in a sense with indigo in nonpolar and polar solvents, respectively. In the former case, indigo-indigo interactions prevail due to the formation of intermolecular H-bonds, giving rise to aggregates of two or more indigo molecules. The palygorskite lattice can be compared to a polar solvent, where single indigo molecules are accommodated. This fact could account for both the narrower and more symmetrical band shape and the red shift observed in Maya blue. 3.2 MICRO-RAMAN SPECTROSCOPYSpectra recorded on Mesoamerican historic samples proved to be identical to the spectrum of modern Maya blue and, for the sake of clarity and brevity, will not be reproduced here. Inorganic compounds usually present in wall painting samples (such as calcium carbonate and gypsum) do not cause interference (as happens in infrared analysis) because their characteristic bands do not overlap with those of indigo. Moreover, the detrimental fluorescence due to the palygorskite matrix was avoided in this study by recording Raman spectra in SERDS mode, as explained in the experimental section. Good S/N ratios and excellent spectral quality were thus achieved. The Raman spectrum of the modern Maya blue, recorded in ordinary mode and in SERDS mode, is shown in figure 5. While the conventional spectrum is somewhat affected by the fluorescence of the palygorskite, the spectral features of Maya blue are still distinguishable. The spectra of crystalline synthetic indigo and modern Maya blue are compared in figure 6. It is interesting to note that, when focusing the laser beam on blue particles present in mixtures prepared by grinding indigo and palygorskite together, without heating, the spectrum recorded had the characteristic features of pure indigo. Unambiguous differentiation of pure indigo from its form fixed on palygorskite is easily achieved by examination of the spectra shown in figure 6. It can be seen that a band at 635 cm-1 disappears when going from pure indigo to Maya blue; likewise, a band at 1365 cm-1 decreases in intensity. At the lower wavenumber end of the spectrum, bands at 240, 253, 267, 276 cm-1 in crystalline indigo coalesce into a single broad band centered at 258 cm-1 in Maya blue. Toward the higher wave numbers, while two bands at 1571 and 1583 cm-1 are found in indigo, only a band
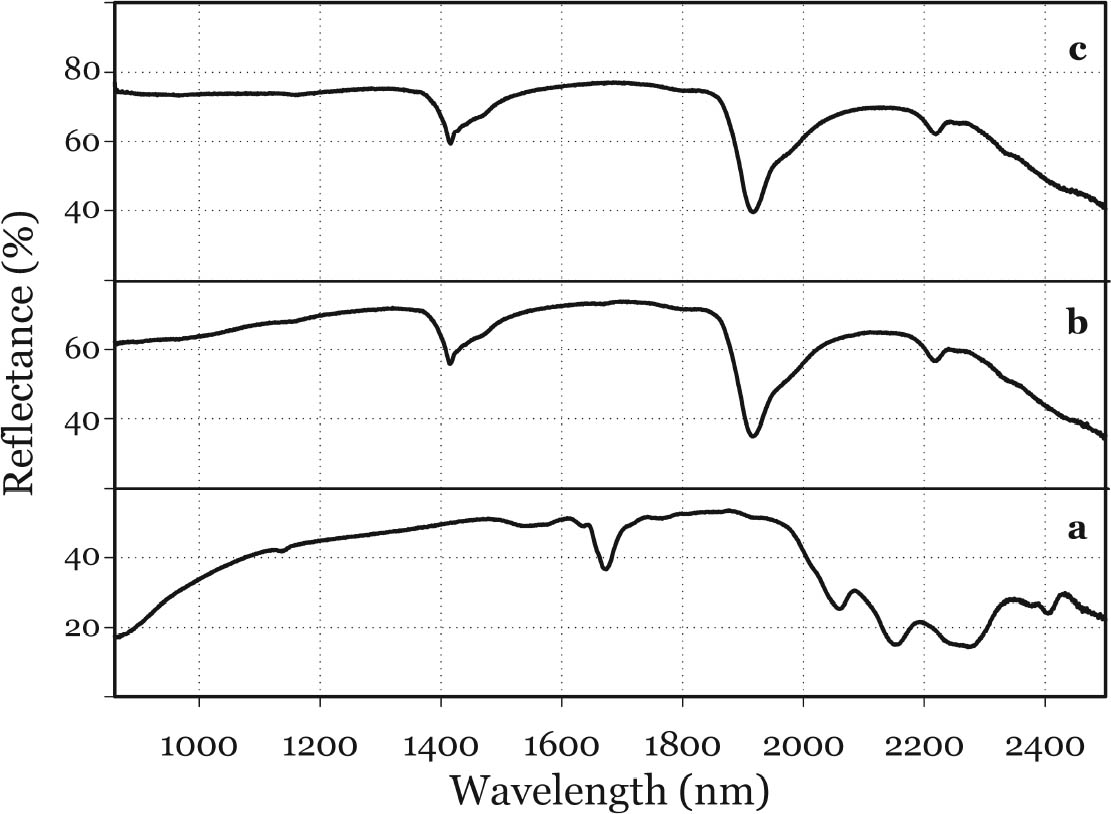
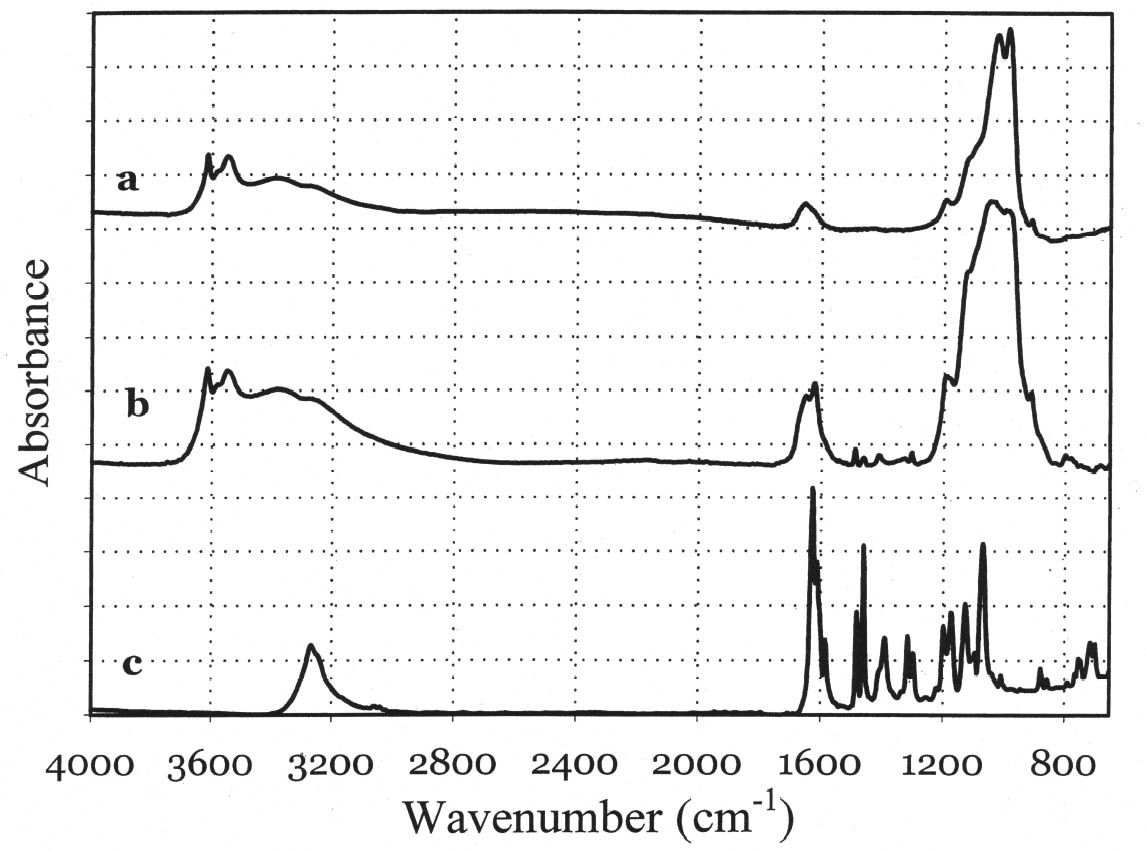
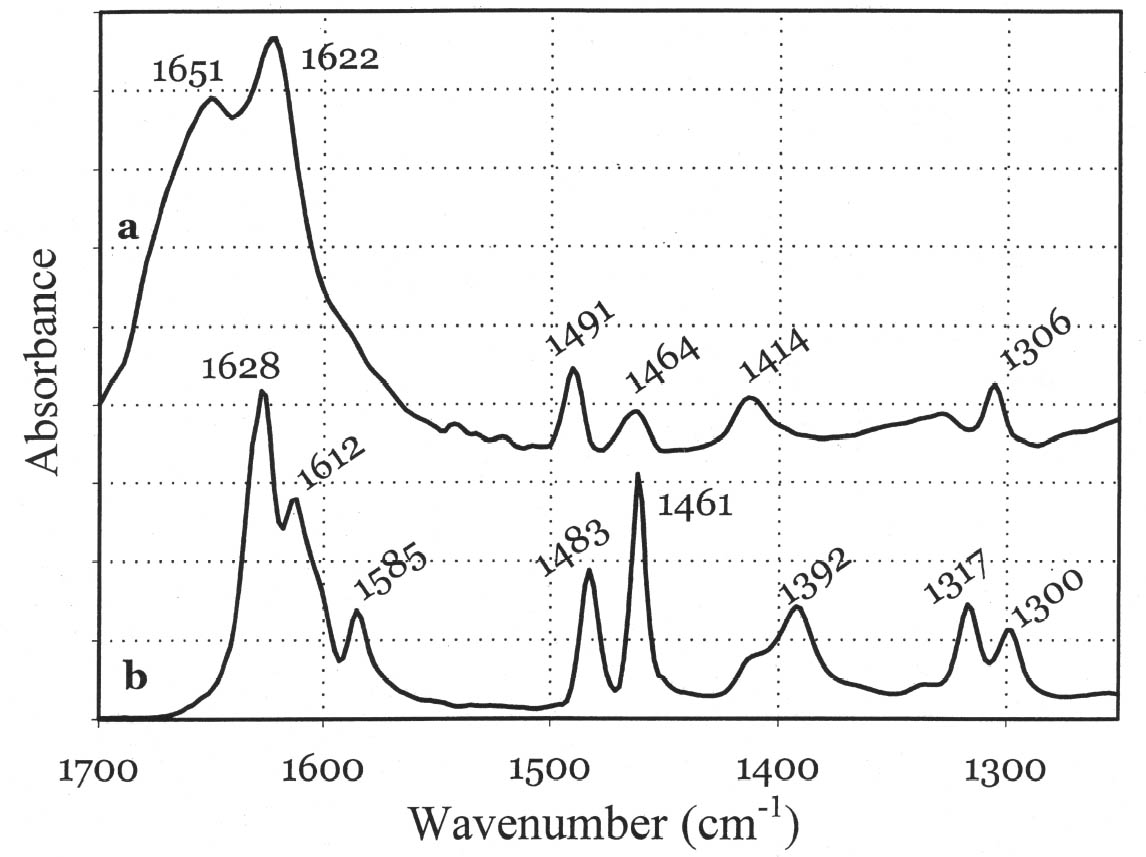
In general, the distribution of electronic charge in a molecule such as indigo shows high polarizability 3.3 FTIR MICROSPECTROSCOPYWhen removal of microscopic samples from the artifact is allowed, FTIR microspectroscopy is a valuable analytical tool for the identification of Maya blue. Using a diamond cell accessory, good-quality spectra can be obtained from particles as small as 50 μm in diameter. Improved spectral quality can be achieved by restricting the analytical window to pigment particles showing the more intense hue after compression in the diamond cell anvil. Infrared spectra distinctly showed specific bands due to the palygorskite and indigo constituents of the Maya blue pigment. A more in-depth analysis of the infrared spectral data for Maya blue is helpful not only to establish FTIR as a viable technique to identify the pigment but also to highlight changes in the carbonyl and amine absorption bands due to fixation on the clay. Indigo is a polyatomic molecule with 30 atoms and 84 vibration modes (Schweppe 1997): a complete assignment of the vibrational bands has been proposed in the literature (Tatsch and Schrader 1995). Spectra obtained on reference samples of palygorskite, modern Maya blue, and indigo are presented in figure 7 (curves a, b, and c, respectively). Some bands clearly attributable to the indigo molecule are visible in the Maya blue spectrum in the region between 1630 and 1250 cm-1, where interference due to the clay is minimal (for a detailed IR study of palygorskite, see Frost et al. 2001).
The strong dependence and high sensitivity of the C=O stretching band to formation and type of H-bond interactions are well known, with indigo being the most sensitive of members of the indigoids series (indigo, selenoindigo, and thioindigo) (Klessinger and L�ttke 1966). Although needing further interpretation, infrared spectral data seem to support the hypothesis (Chiari et al. 2003) that, when in the channels of palygorskite (7.3 � wide), the indigo molecule (4.8 � wide) is hydrogen-bonded to the clay hydroxyls only through its C=O groups, with the NH groups remaining free. The band relative to N-H bending of the indigo molecule disappears in Maya blue, while it is known (Colthup et al. 1975) that generally H-bonding leads to an increase in N-H bending frequencies, a broadening of the spectral band, and an increase in IR intensity. The disappearance of the bands at 1392 cm-1 in the IR spectrum and at 635 cm-1 in the Raman spectrum points to a variation in charge distribution for the N atom in Maya blue compared to crystalline indigo (where the hydrogen of the N-H group and the oxygen of the C=O group of a neighboring molecule form a hydrogen bond). Molecular orbital calculations performed on the basis of an extended Huckel molecular orbital approach (Mealli and Proserpio 1990) confirm this assertion by
4 CONCLUSIONSThe electronic structure of indigo is different for molecules of the pure dye and molecules located within the structure of palygorskite, as in the pre-Columbian pigment Maya blue. Different microenvironments surrounding the indigo molecule cause modifications in the electronic structure of the indigo molecule, giving rise to different spectral characteristics. Simple spectroscopic measurements can easily differentiate between indigo and Maya blue. UV-Vis FORS can successfully identify Maya blue since the electronic spectrum of the pre-Columbian pigment displays a less broad and more prominent band in the 540–730 nm range, while the spectrum of pure indigo is always characterized by a very broad and asymmetric band in the 420–730 nm range. Micro Raman and FTIR spectroscopy distinguish Maya blue from pure indigo, based on modifications of the vibrational spectrum related to changes in the charge distribution of the indigo molecule, as a result of its fixation on palygorskite during the synthesis of the Maya blue pigment. Moreover, techniques such as FORS and micro Raman offer the important advantage of in situ, noninvasive identification of the pigments, thus resulting in a simple and safe methodology for the investigation of different objects of cultural significance. ACKNOWLEDGEMENTSThe idea for this project came from an inquiry from Dulce Maria Grimaldi, Coordinacion Nacional de Conservacion del Patrimonio Cultural, Mexico, DF, Mexico, who kindly provided Marco Leona with the Maya blue sample from the Templo Mayor. The authors would also like to thank Jun Zhao, Chromex Inc., for recording the SERDS spectrum of modern Maya blue. Virginia Fields, curator of pre-Columbian art, LACMA, allowed Marco Leona to analyze the blue coating on the Jaina figurine from LACMA. Giacomo Chiari was extremely helpful to the authors and kindly provided advance copies of his publications on Maya blue. Analytical work at LACMA was made possible by a generous grant from the Andrew W. Mellon Foundation. REFERENCESAj�, D., G.Chiari, F.De Zuane, M.Favaro, and M.Bertolin. 1996. Photoluminescence of some blue natural pigments and related synthetic materials. In Art '96 proceedings. 5th International Conference on Non-destructive Testing, Microanalytical Methods and Environmental Evaluation for Study and Conservation of Works of Art, Budapest, September 24–28, 1996. 33–47. Aldrovandi, A., M.Bacci, L.Bussotti, E.Castellucci, F.Lucarelli, P. A.Mand�, M.Matteini, G. P.Mei, L.Montalbano, M.Picollo, B.Radicati, C.Rossi, M.Silli, M. G.Vaccari.1997. Il “Taccuino” di Giovannino de' Grassi della Biblioteca Civica di Bergamo: Tecnica di esecuzione e restauro. OPD Restauro9:15–37. Allen, F. S., J.Zhao, and D. S.Butterfield. 2000. Apparatus for measuring and applying instrumentation correction to produce a standard Raman spectrum. U. S. Patent 6, 141, 095. Assigned to Chromex Inc., Albuquerque, N. M. AngelS. M., M.Carrabba>, and T. F.Cooney. 1995. The utilization of diode lasers for Raman spectroscopy. Spectrochimica Acta Part A51:1779–99. Bacci, M.2000. UV-VIS-NIR, FT-IR, and FORS spectroscopies. In Modern analytical methods in art and archaeology. New York: John Wiley & Sons. 321–61. Bacci, M., S.Baronti, A.Casini, F.Lotti, M.Picollo, and O.Casazza. 1992. Non-destructive spectroscopic investigations on paintings using optical fibers. Materials issues in art and archaeology III. Materials Research Society Symposium Proceedings 267, ed. P. B.Vandiver, J. R.Druzik, G. S.Wheeler, and L. C.Freestone.Pittsburgh: Materials Research Society. 265–83. Bacci, M., and M.Picollo. 1996. Non-destructive spectroscopic detection of cobalt (II) in paintings and glass. Studies in Conservation41:136–44. Bacci, M., M.Picollo, and B.Radicati. 1995. Determinazione dei pigmenti blu mediante spettroscopia di riflettanza non distruttiva. In La Madonna di San Giorgio alla Costa di Giotto, ed. M.Ciatti and C.Frosinini.Florence: EDIFIR Edizioni Firenze. 87–88. Cariati, F., and S.Bruni. 2000. Raman spectroscopy. In Modern analytical methods in art and archaeology. New York: John Wiley & Sons. 255–78. Chiari, G., 2001. Study of the pigment Maya blue. Report on Getty Conservation Institute Guest Scholar Grant 2001. Getty Conservation Institute, Los Angeles.
Chiari, G., D.Aj�, C.Reyes-Valerio, C.Virdis, G.Pozza, and F.De Zuane. 1999. Applications of photoluminescence spectroscopy to the investigation of materials used in works of art. In Art '99 proceedings. 6th International Conference on Non-destructive Testing and Microanalysis for the Diagnostics and Conservation of the Cultural and Environmental Heritage, Rome, May 17–20, 1999. Rome: Euroma. 1717–26. Chiari, G., R.Giustetto, and G.Ricchiardi. 2003. Crystal structure refinements of palygorskite and Maya blue from molecular modelling and powder synchrotron diffraction. European Journal of Mineralogy15(1):21–33. Clark, R. J. H.1995. Raman microscopy: Application to the identification of pigments on medieval manuscripts. Chemical Society Reviews24(3):187–96. Colthup, N. B., S. E.Wiberley, and L. H.Daly. 1975. Introduction to infrared and Raman spectroscopy. New York: Academic Press. Coupry, C., A.Lauti�, and R.Perkinson. 1996. Les papiers bleus: Identification des colorants. Techne4:99–107. Coupry, C., G.Sagon, and P.Gorguet-Ballesteros. 1997. Raman spectrocopic investigation of blue contemporary textiles. Journal of Raman Spectroscopy28:85–89. Frost, R. L., O. B.Locos, H.Ruan, and J. T.Kloprogge. 2001. Near infrared and mid-infrared spectroscopic study of sepiolites and palygorskites. Vibrational Spectroscopy27:1–13. Gettens, R. J.1962. Maya blue: An unsolved problem in ancient pigments. American Antiquity27:557–64. Grimaldi, D. M.2000. Painting techniques and deterioration due to air pollution of the wall paintings of the Aztecs at the Great Temple of Tenochtitlan, in Mexico City (master in art conservation thesis, Queen's University, Kingston, Ontario, Canada). Guineau, B.1987. L'�tude des pigments par les moyens de la microspectrom�trie Raman. PACT 17, Datation-Caract�risation des peintures pari�tales et murales. 4th European postgraduate course. Ed. F.Delamare, T.Hackens, and B.Helly.Court-Saint-Etienne, Belgium: Oleffe. 259–94. Guineau, B.1989. Non-destructive analysis of organic pigments and dyes using Raman microprobe, microfluorometer or absorption microspectrophotometer. Studies in Conservation34(1):38–44. Itoh, S., S.Ohno, N.Hasegawa, and H.Takahashi. 1989. Resonance Raman study of the structures of trans and cis isomers and the C=C stretching frequencies of N, N'-derivatives of indigo. Journal of Raman Spectroscopy20:423–30. Kleber, R., L.Masschelein-Kleiner, and J.Thissen. 1967. Study and identification of Maya blue. Studies in Conservation12(2):41–56. Klessinger, M., and W.L�ttke. 1966. Theoretische und spektroskopische Untersuchungen an Indigofarbstoffen. Part 3, Der Einflu� zwischenmolekularer Waserstoffbr�cken auf die Spektren von Indigo im festen Zustand. Chemische Berichte99:2136–45. Leona, M.1999. Edo blues: UV-vis, FTIR and GC-MS identification of blue colorants in Japanese paintings of the Edo period.EAS Final Program. 38th Annual Eastern Analytical Symposium, Somerset, N. J., November 14–20 112. Leona, M., and J.Winter. 2001. Fiber optics reflectance spectroscopy: A unique tool for the investigation of Japanese paintings. Studies in Conservation46:153–62. Littmann, E. R.1980. Maya blue: A new perspective. American Antiquity45:87–100. Littmann, E. R.1982. Maya blue: Further perspectives and the possible use of indigo as the colorant. American Antiquity47:404–8.
Magaloni, D., M.Aguilar, and V.Casta�o. 1991. Electron and optical microscopy of prehispanic mural paintings. In Materials issues in art and archaeology, vol. 2. Materials Research Society Symposium Proceedings 185, ed. P.Vandiver et al. Pittsburgh: Materials Research Society. 145–50. Mealli, C., and D. M.Proserpio. 1990. MO theory made visible. Journal of Chemical Education67:399–402and references therein. Merwin, H. E.1931. Chemical analysis of pigments. In The Temple of the warriors at Chichen Itza, Yucatan, ed. E.H.Morris, J.Charlot, and A. A.Morris.Carnegie Institution of Washington publication 406. Washington D. C.: Carnegie Institution of Washington. 355–56. Miliani, C., A.Romani, and G.Favaro. 1998. A spectrophotometric and fluorimetric study of some anthraquinoid and indigoid colorants used in artistic paintings. Spectrochimica Acta Part A54:581–88. Monahan, A. R., and J. E.Kuder. 1972. Spectroscopic differences between crystalline and amorphous phases of indigo. Journal of Organic Chemistry37(25):4182–84. Palacios-Lazcano, L., and C.Reyes-Valerio. 1993. De Bonampak al templo Mayor: El azul maya in Mesoamerica. Mexico City: Siglo XXI Editores. app., 143–54. Polette, L. A., G.Meitzner, M. J.Yacam�n, and R. R.Chianelli. 2002. Maya blue: Application of XAS and HRTEM to materials science in art and archaeology. Microchemical Journal71(2–3):167–74. Polette, L. A., N.Ugarte, M.Ortego, and R. R.Chianelli. 1998. Study of Maya blue paint by synchrotron techniques and scanning electron microscopy. Electron microscopy proceedings. 14th International Congress on Electron Microscopy, Cancun, Mexico. Bristol, UK: Institute of Physics Publishing. 259–60. Roundhill, L. S., D.Reents-Budet, P.McGovern, and R.Michel. 1989. Maya blue: A fresh look at an old controversy. In Seventh Palenque Round Table, ed. M. G.Robertson and V. H.Fields.San Francisco: Pre-Columbian Art Research Institute. 253–56. Schweppe, H.1997. Indigo and woad. In Artists' pigments: A handbook of their history and characteristics. Vol. 3, ed. E. W.FitzHugh.New York: Oxford University Press. 81–108. Serrano-Andr�s, L., and B. O.Roos. 1997. A theoretical study of the indigoid dyes and their chromophore. Chemistry in Europe Journal3(5):717–25. Shepard, A. O., and H. B.Gottlieb. 1962. Maya blue: Alternative hypothesis. In Notes from a ceramic laboratory 1. Washington, D. C.: Carnegie Institution of Washington. Singer, B. W., D. J.Gardiner, and J. P.Derow. 1993. Analysis of white and blue pigments from watercolors by Raman microscopy. Paper Conservator: Journal of the Institute of Paper Conservation17:13–19. Smith, G. D., and R. J. H.Clark. 2001. Raman microscopy in art history and conservation science. Reviews in Conservation2:92–106. Spoto, G., A.Torrisi, and A.Contino. 2000. Probing archaeological and artistic solid materials by spatially resolved analytical techniques. Chemical Society Reviews29:429–39. S�sse, P., M.Steins, and V.Kupcik. 1988. Indigo: Crystal structure refinement based on synchrotron data. Zeitschrift f�r Kristallographie184:269–73. Tatsch, E., and B.Schrader. 1995. Near infrared Fourier transform Raman spectroscopy of indigoids. Journal of Raman Spectroscopy26:467–73. Van Olphen, H.1966. Maya blue: A clay-organic pigment? Science154(3749):645–46.
Withnall, R., R. J. H.Clark, C. J.Cooksey, and M. A. M.Daniels. 1992. Non-destructive, in situ identification of indigo/woad and shellfish purple by Raman microscopy and visible reflectance spectroscopy. Dyes in history and archaeology11:19–24. Yacam�n, M. J., L.Rend�n, J.Arenas, and C. M.Serra Puche. 1996. Maya blue paint: An ancient nanostructured material. Science273:2235. Yacam�n, M. J., and C. M.Serra Puche. 1995. Highresolution electron microscopy of Maya blue paint. Materials issues in art and archaeology IV. Materials Research Society Symposium Proceedings 352, ed. P. B.Vandiver and J. R.Druzik.Pittsburgh: Materials Research Society. 3–11. Zhao, J., M. M.Carrabba, and F. S.Allen. 2002. Automated fluorescence rejection using shifted excitation Raman difference spectroscopy. Applied Spectroscopy56(7):834–45. AUTHOR INFORMATIONMARCO LEONA, scientist-in-charge of the newly formed science group at the Metropolitan Museum of Art, New York, holds an M.S. in chemistry and a Ph.D. in mineralogy and crystallography from the University of Pavia, Italy. His main area of interest is the development of noninvasive analytical techniques for the study of works of art and artists' materials. This article was written when he was senior conservation scientist at the Los Angeles County Museum of Art. Address: Metropolitan Museum of Art, 1000 Fifth Ave., New York, N.Y. 10028; e-mail: marco.leona@metmuseum.org FRANCESCA CASADIO received her Ph.D. in chemistry from the Universit� degli Studi di Milano, Italy. She was graduate intern in the Science Department at the Getty Conservation Institute, Los Angeles, then research fellow at the ICVBC-CNR “Gino Bozza” in Milan. Since July 2003 she has been conservation scientist at the Art Institute of Chicago. Address: Art Institute of Chicago, 111 South Michigan Ave., Chicago, Ill. 60603-6110; e-mail: fcasadio@artic.edu MAURO BACCI is director of research at the Institute of Applied Physics “Nello Carrara” IFAC-CNR, Florence. His main interest is in spectroscopy from both a theoretical and an applied point of view. For many years he has been developing totally nondestructive spectroscopic techniques for the study of works of art. Address: Institute of Applied Physics “Nello Carrara” IFAC-CNR, Via Panciatichi 64, 50127 Firenze, Italy; e-mail: m.bacci@ifac.cnr.it MARCELLO PICOLLO is a researcher at the Institute of Applied Physics “Nello Carrara” IFAC-CNR, Florence, who has been working on spectroscopic investigations of works of art since 1991. His main focus is on pigment characterization using totally nondestructive spectroscopic, imaging, and x-ray techniques. Address: as for Bacci; e-mail: m.picollo@ifac.cnr.it
 Section Index Section Index |