POLYMER TREATMENTS FOR STONE CONSERVATION: METHODS FOR EVALUATING PENETRATION DEPTHFRANCESCA CASADIO, & LUCIA TONIOLO
4 RESULTS AND DISCUSSION4.1 MICRO-ATR SPECTROSCOPYExamination was performed on cross sections placed on the motorized microscope stage and subjected to repeated spectral recordings at increasing depths. The technique is very promising because it allows direct, nondestructive probing of the examined surface, coupling microscopic visible-light observation with infrared spectra as a function of Cartesian coordinates with a spatial resolution of 50‐100 μm, without further manipulation or preparation of the sample. The major drawback of the method is the need for perfect contact between the ATR probe crystal and the investigated micro-area (100 μm in diameter) to obtain a reasonable signal and an acceptable spectrum, a condition not easily achieved when investigating rough stone surfaces. In addition, the technique, like other infrared applications, is generally qualitative, allowing at best semi-quantitative assessment of the polymer's presence at different depths. Results obtained on highly porous calcareous
In the case of marble, a lithotype characterized by low total open porosity (< 1%), positive identification of the different polymers by the micro-ATR mapping technique was confined to the first few microns (around 100 �m) of the top surface. 4.2 DIAMOND CELL FTIRSince the main difficulty in direct determination of polymers in treated stones is often the dominating signal of the inorganic substrate, which masks the weaker signals of organic compounds, one analytical strategy involves eliminating the calcareous stone matrix by acid attack with 0.2 normal (N) HCl solution followed by analysis of the residues with diamond cell FTIR spectroscopy. By removing all interfering CaCO3, whose intense absorption bands often mask peaks belonging to the polymeric material, the presence of the different treatments can be unambiguously detected. Instead of probing a single cross section surface of a sample, this methodology
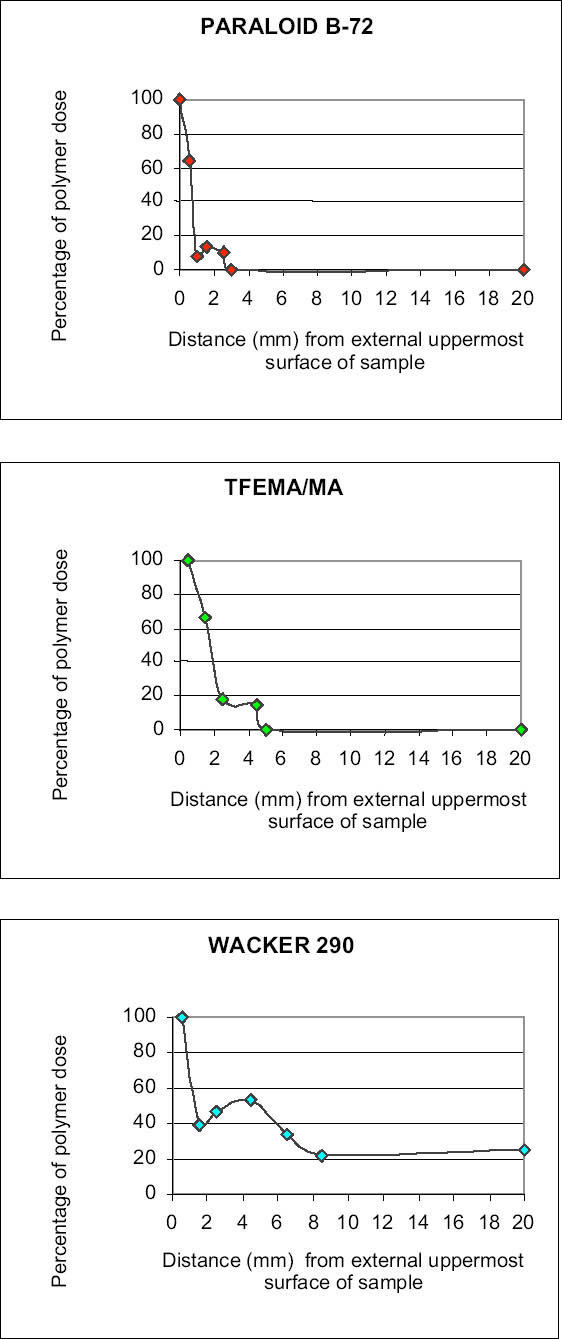
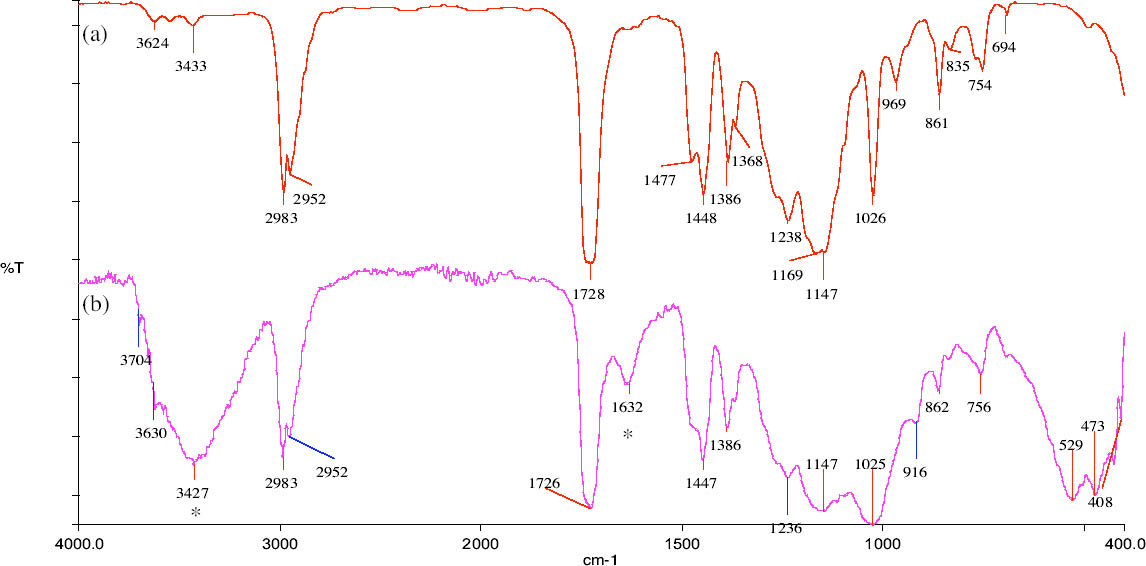
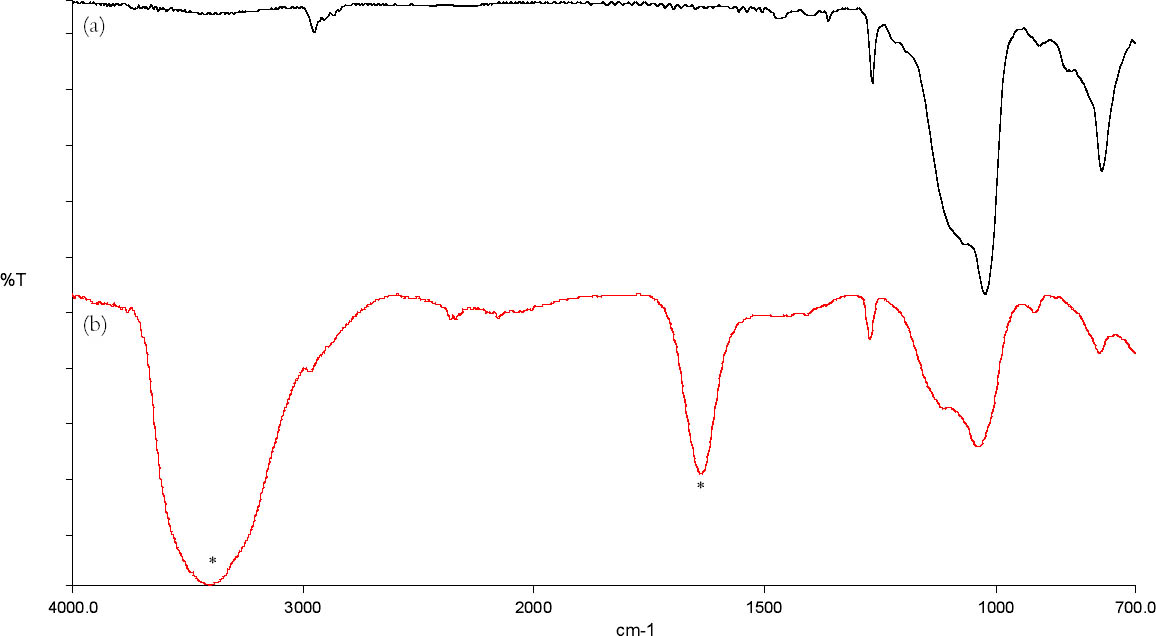
Acid attack was performed on powders ground from different sections of the samples to obtain information about the depth to which the polymer had penetrated. The technique proved to be more effective with stone substrates characterized by medium-high porosity values than with low-porous stones such as marble, since high-porous stones contained significantly higher quantities of polymeric materials. Samples of yellow Angera stone and Noto stone treated with Paraloid B-72 confirmed the tendency for the acrylic resin to form a film, as it was detected only in the uppermost section examined for both (i.e., within the first 2 mm). Figure 3 demonstrates how closely the spectrum obtained on the residue, after acid treatment, of the powder obtained from the uppermost section of a treated Noto stone sample matches the reference standard spectrum for Paraloid B-72. The only extraneous bands in the spectrum are those characteristic of silicates and iron oxides and hydroxides present in Noto stone and of calcium chloride (CaCl2) (as the bi-or hexahydrate salt, formed during treatment of CaCO3 with HCl), the latter centered at 1640 cm-1 in association with the broad band due to stretching modes of hydroxyl (OH) groups, centered at 3427 cm-1 (Nyquist and Kagel 1997). On the other hand, investigation of samples treated with Wacker 290 confirmed in-depth impregnation of both substrates by the siloxane oligomers. In fact, traces of the silicone resin were still detectable in sections corresponding to all levels inside the stone samples (fig. 1: positive detection down to section Z = 18‐20 mm). Figure 4 shows the spectrum obtained after acid dissolution of a section corresponding to 12‐14 mm inside Noto stone treated with Wacker 290. It is interesting to note that
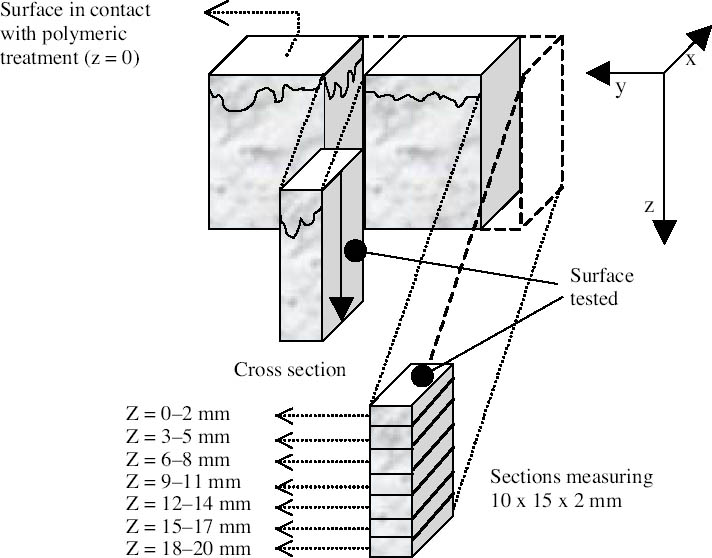
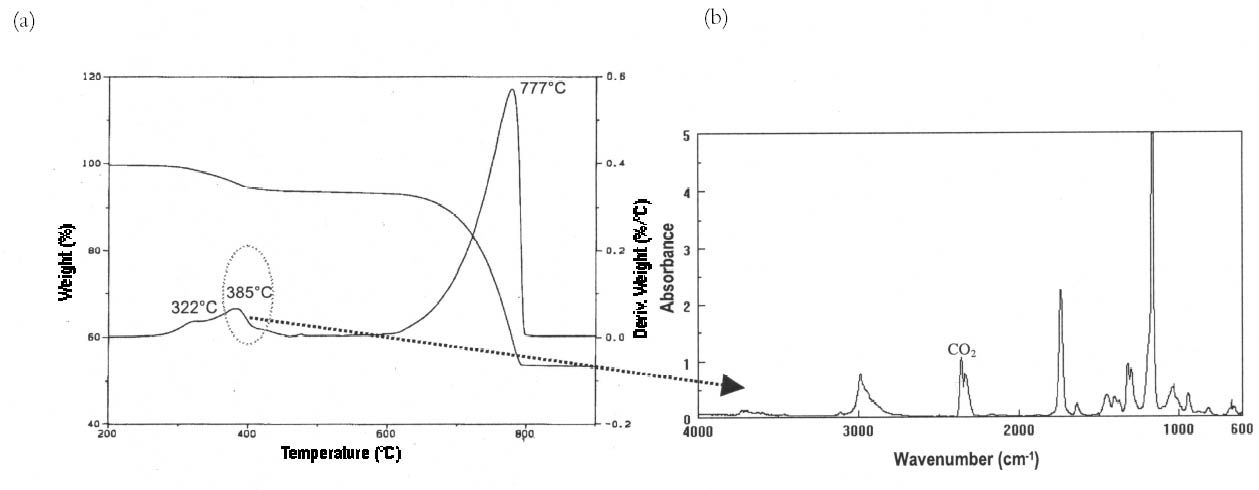
In the case of marble, positive identification of polymers was possible only in the powders obtained by scraping the top surface of the stone samples with a scalpel. The treatment was invariably located in the uppermost region of the first cut section and, when sections cut from deeper regions were attacked with acid, no residue of polymer was recovered. 4.3 TG-FTIRThe combination of thermogravimetric and infrared analyses provides precise quantitative data on the various components of the investigated systems along with step-by-step infrared fingerprinting of volatile compounds emitted during thermal degradation. It is thus possible to ascribe each individual weight loss to the emission of certain gases, therefore identifying without any ambiguity the compound responsible for such weight loss. For the analysis, sections of the treated stone samples were ground and 30 mg of the resulting powder was placed in the platinum crucible of the thermobalance and submitted to heating from 40�C to 900�C at a speed of 10�C/min in helium flux. In the examined samples, the technique was capable of discriminating between organic polymer and inorganic matrix. Moreover, the method has the advantage of allowing precise quantitative determination of the doses of polymers, can highlight eventual interaction between the organic and inorganic phases, and has the benefit that, following cutting of the samples into sections, it requires very simple preparation. The main disadvantages of the technique are the limited spatial resolution due to the sample cutting procedure (see fig. 1) and its inappropriateness for resins with a complex degradation pattern (such as highly cross-linked resins) that leave a significant carbonized residue after degradation. As an example, no significant results were obtained from specimens treated with the siloxane Wacker 290 because of its
Differences in penetration depths reached by Paraloid B-72 and its fluorinated homologue in Candoglia marble and Noto stone were determined. On one hand, both resins were observed only in the first section of treated marble samples, corresponding to the first 2 mm of the uppermost surface. On the other hand, when applied on highly porous substrate such as Noto stone, TFEMA/MA was found to be present in two sections, corresponding to 5 mm from the top surface, while Paraloid B-72 was confined only to the first section. Moreover, the quantity of Paraloid B-72 impregnating the first section of the Noto stone sample was found to be equal to 5.7% of the total weight of sample analyzed, while it was equal to 0.43% in Candoglia marble. In the case of TFEMA/MA, 8.01% of the polymer was contained in the uppermost section of Noto stone, and 1.15% in the uppermost marble section table 3. It is interesting to note that the thermal degradation of the polymeric chains, corresponding to a maximum in the DTG curves, takes place at lower temperatures for the polymers applied on stone, with respect to temperatures observed for the pure polymers used as standard reference. This observation led to the hypothesis that polymers establish some electrostatic interaction with the stone substrate, resulting in slightly lower electronic density in proximity to the backbone of the polymer, which is, therefore, more susceptible to thermal degradation (i.e., slightly less energy is required to break the polymer chain).
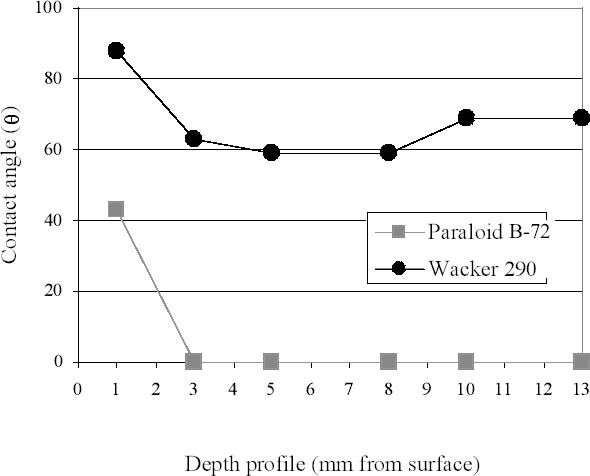
4.4 STATIC CONTACT ANGLEThe determination of superficial water repellency of stone-polymer systems by measuring static contact angles can indicate the presence of polymers on porous substrates. When water repellency is measured on the surface of cross sections of treated samples, data obtained can be related to penetration depths of polymers inside the stones (Biscontin et al. 1993; Littmann et al. 1993; Delgado Rodrigues et al. 1996; Leroux et al. 2000). This very simple and lowtech method was used to check the general reliability of results obtained by various infrared spectroscopic approaches. Major advantages are the ease of measurement and the effective visualization of the hydrophobization of the substrate, which, in turn, indicates the actual polymer's presence within the stone material. Major limitations are low spatial resolution (due to the relatively large dimensions of the microdrops) and the nature of indirect measurements, which are sometimes prone to more ambiguity than direct determinations. The impregnating behavior of the three tested resins applied on medium (Angera stone) and high (Noto stone) porous stone was compared. Figure 6 reports values of contact angle measured on cross sections of treated Angera stone samples as a function of depth profile. It is evident that, while Wacker 290 evenly impregnated the whole sample, providing widespread water repellency, Paraloid B-72 was confined in the upper sections, since the stone immediately absorbed drops deposited 3 mm below the uppermost surface. Measurements of static contact angles at different depths were also associated with photographs, taken through a stereomicroscope, of the water-repellency properties of the tested surfaces. Water microdrops were deposited on the whole length of cross sections, and a photograph was taken after two minutes in order to record which, among the drops, retained their spherical shape because of the hydrophobicity of the surface and which, instead, had been absorbed. Results are shown in figure 7‐11. They clearly indicate
In the case of marble, static contact angles measured on the treated surface generally showed lower values than those measured on samples of more porous substrates treated with the same polymer material. Surface roughness is, in such measurements, the critical parameter directly correlated with the static angle values (Della Volpe et al. 2000) and, in the case of marble surfaces, the angles' values generally match those observed for the polymer itself when applied as a film on an inert and smooth substrate (glass or metal slides). Moreover, the testing of the marble cross sections did not allow visualization of water drops beneath the uppermost surface of the specimens, thus confirming the limited penetration of the various polymers on this substrate. |