“A TRANSPARENT ATMOSPHERE”: THE PAPER NEGATIVES OF FR�D�RIC FLACH�RON IN THE HARRISON D. HORBLIT COLLECTIONLEE ANN DAFFNER
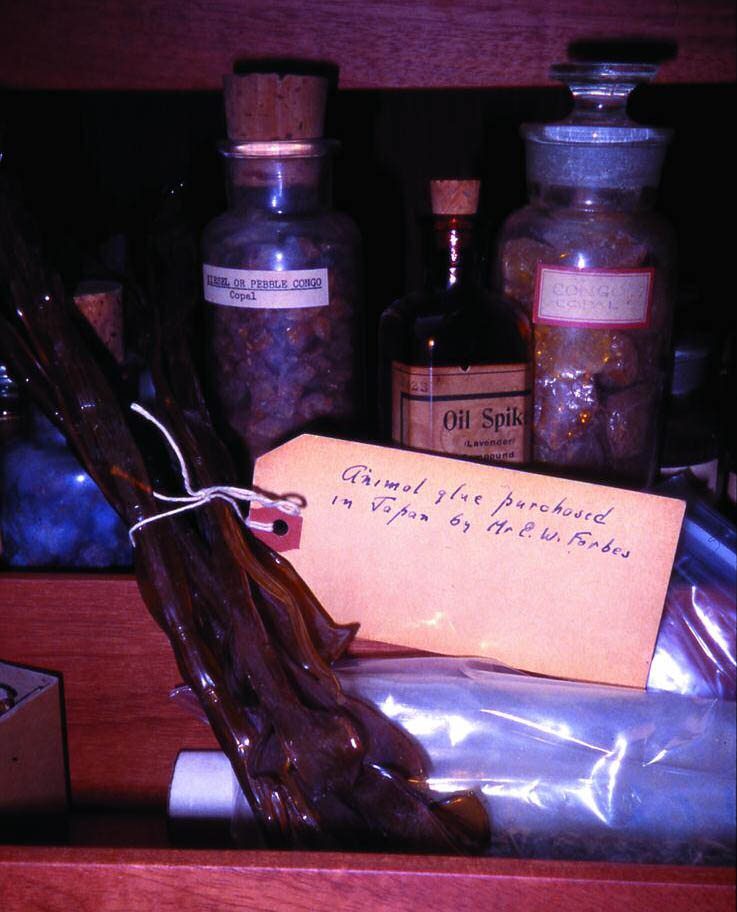
3 ANALYSIS OF THE NEGATIVESThe identification and interpretation of these coatings were material in understanding Flach�ron's working process. Was he experimenting with different waxes and resin admixtures? Could specific discoloration in the negatives be attributed to the aging of a specific resin? Identification and evaluation of these components became the focus of the analysis. Instrumental analysis was undertaken at the Straus Center for Conservation at the Harvard University Art Museums, with Amy Snodgrass, associate conservation scientist. Fourier transform infrared spectroscopy yields spectra in the midinfrared region for organic and inorganic compounds present in or on a sample. The identification of a material from its infrared spectrum generally requires an assignment of its band positions and intensities as well as comparison to spectra of known materials. This procedure can be straightforward with pure samples; however, as is often the case with historic objects, samples may have aged or contain a mixture of materials, greatly complicating the proper assignment of functional groups. The Gettens Collection of Aged Materials at the Straus Center for Conservation is a unique and valuable resource. It contains organic materials traditionally used by artists, such as waxes, resins, gums, and glues (fig. 12, see page 448). Since this reference library has undergone some aging of its own, it provides the opportunity to construct a reference of aged samples. In 1993, Amy Snodgrass and Beth Price of the Philadelphia Museum of Art created a spectral library from 267 samples from the Gettens Collection of Aged Materials. Key samples underwent systematic verification by alternate means, confirming their spectra with published data. Because it is composed primarily of traditional fine art painting materials, this reference collection was considered appropriate for the evaluation of the negatives. Due to his artistic training and close associations with professional
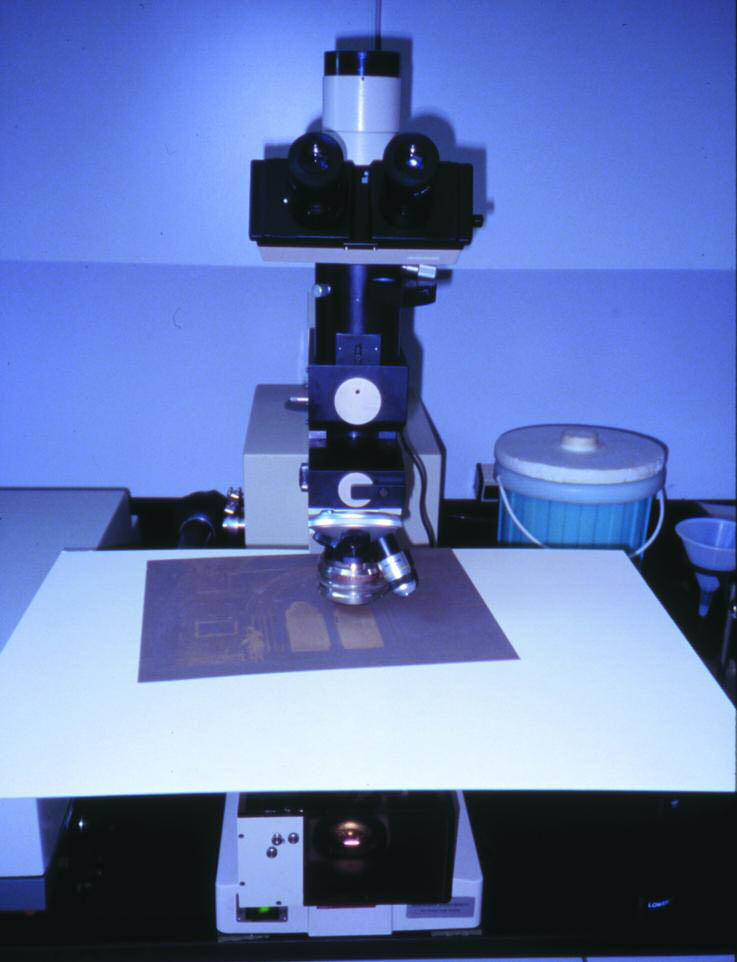
3.1 INSTRUMENTAL METHOD: FTIRFTIR microspectroscopy was performed using a Spectra-Tech IR-Plan microscope attached to a Nicolet 510M spectrometer with an auxiliary MCT detector. The FTIR spectrometer at the Straus Center has an attached microscope, which is designed for the analysis of microscopic samples. For our purposes, however, a mat board platform with a small portal for the infrared beam was fabricated and secured to the stage of the FTIR microscope. Initially it was of overriding interest to utilize a nondestructive method for analysis, so the following system was developed. The paper negative was positioned on top of the platform, and a spectrum was gathered from each negative as the infrared beam passed through the sheet of paper in transmittance mode (fig. 13, see page 448). Two hundred scans were averaged at a spectral resolution of 8 cm-1. The resulting spectra were viewed in absorbance mode between 625 and 4,000 wavenumbers. Random areas for analysis were chosen on each negative, located in the highlights where very little or no silver image was present, usually near the center of the image. The procedure took about 15 minutes per negative.
3.2 INTERPRETATIONThe spectra produced by nondestructive transmittance showed absorbances both for paper and for any materials that Flach�ron might have applied to it (fig. 14). The paper was too thick for adequate transmittance of the infrared beam for the strongest absorbing frequencies. The strong bands between 3000 and 3600 wavenumbers for O-H and between 2800 and 3000 wavenumbers for C-H and between 1000 and 1200 wavenumbers in the spectral fingerprint region are cut off. Although the thickness of the paper caused a loss of information for the strongest bands, it had the unanticipated benefit of enhancing the weaker bands. Most of the absorbances in the spectra are for cellulose; however, the prominent absorbance at 1737 in the carbonyl region indicates the presence of another material. To identify this component, the cellulose absorbances were mathematically subtracted from the spectrum. For subtraction we used a spectrum from an analytical grade filter paper, Whatman no. 4 Qualitative, which is 99% pure cellulose and similar in thickness to the negative paper. The result of the subtraction suggested absorbances characteristic of beeswax, possibly with an admixture (fig. 15). To evaluate these findings, the decision was made to augment analysis with gas chromatography—mass spectrometry (GC-MS). This decision was carefully considered due to two factors: the samples for GCMS require destructive sampling, and the wax and resin layers are extremely thin, limiting the actual amount of material available. Therefore the sampling was taken near the edge of the paper and, when possible, from a previously damaged area, and away from the silver image. The aid of a stereomicroscope ensured that the amounts retrieved were small enough that there was no visible alteration to the area. The exact quantity of sample retrieved was roughly equivalent to the period at the end of this sentence. This amount is slightly smaller than the amount normally required for GC-MS. Richard Newman, research scientist, performed the GC-MS analysis at the Museum of Fine Arts, Boston. The resulting compounds confirmed the presence of beeswax and a hydrocarbon wax, such as paraffin. From the initial visual examination of 32 negatives, it appeared that 8 might contain a high resin content. With FTIR, 4 were found to contain absorbances for resin (fig. 16). To further evaluate these findings, microscopic samples of resin were removed from the surface of four negatives following our sample-taking protocol and analyzed by FTIR. The four spectra were identical, with a 98% match to the Gettens references for sandarac resin (fig. 17). GC-MS performed on a sample from one of the negatives suggested the varnish was a mixture of oil, sandarac, and pine resin. These findings underscore several limitations to consider when undertaking analytical investigation of extremely thin layers, such as with the paper negatives. In this project, it was of paramount importance |