MANAGING CHANGE: THE ROLE OF DOCUMENTATION AND CONDITION SURVEY AT MESA VERDE NATIONAL PARKFRANK G. MATERO
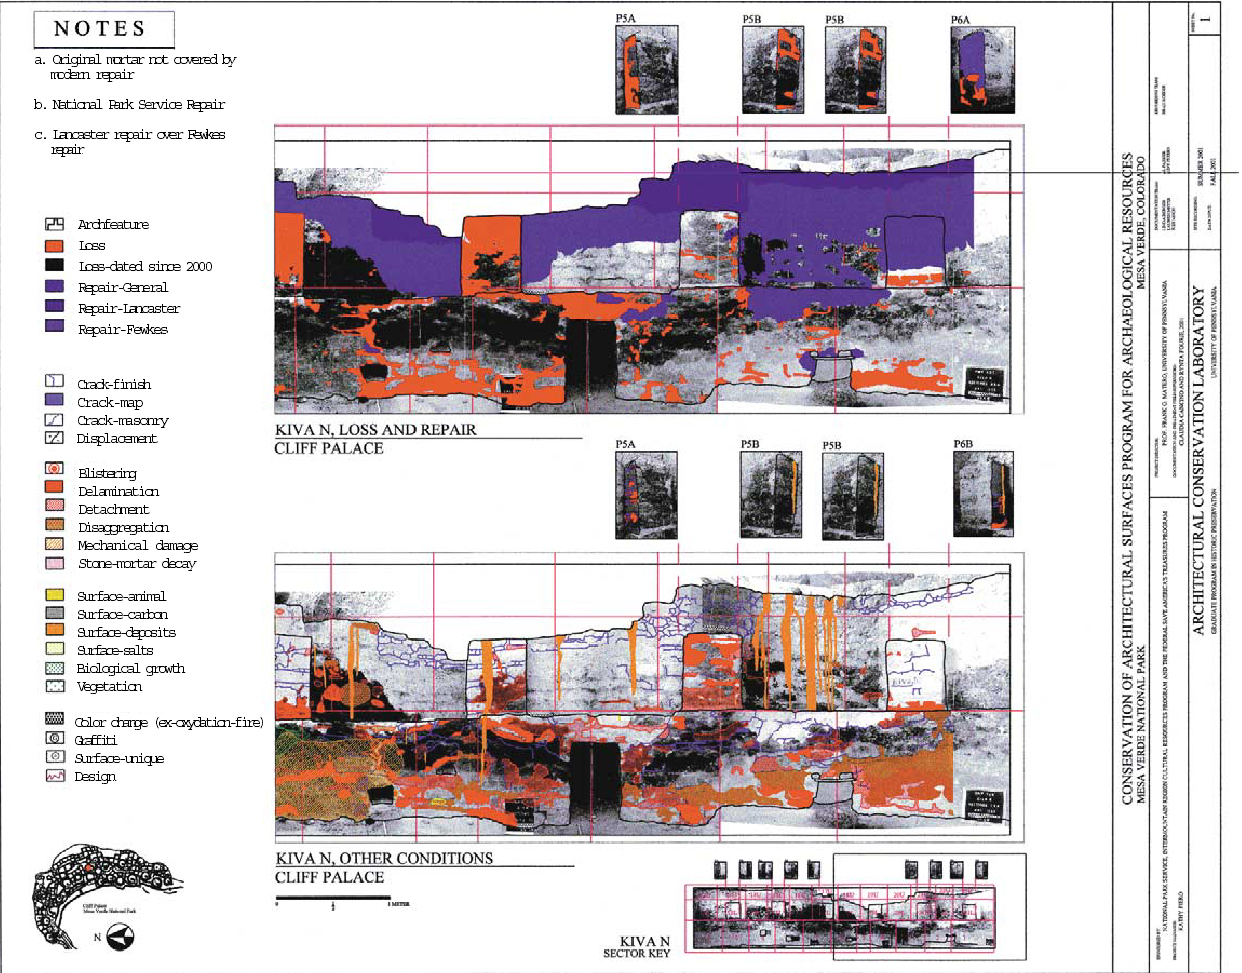
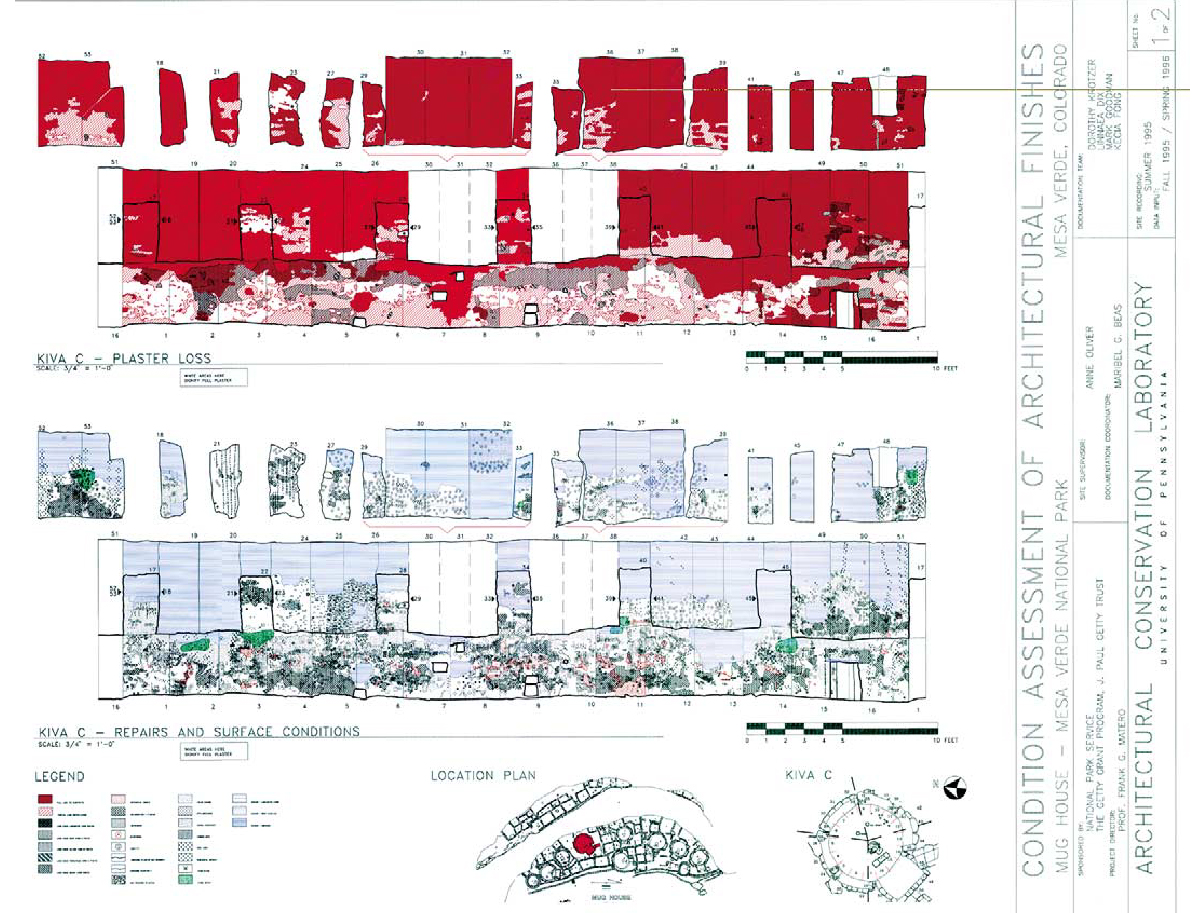
2 METHODOLOGY2.1 FIELD DOCUMENTATIONA sequence of field investigation and recording and off-site data processing was undertaken to document and assess the current conditions of two representative spaces in Mug House. While the details of any methodology are important to report for critical discussion and application, it is important to emphasize that the specific tools of the process—i.e., software and hardware—will change as a function of technological improvements. This development has certainly been the case in this and other projects, with the rapid innovations in applied digital information technology. What remains significant in the reporting of the methodology is the process itself: its goals, objectives, phasing, and ultimate diagnostic value for remedial treatment and preventive conservation for this and similar sites worldwide. 2.1.1 ARCHITECTURAL SURVEYIn preparation for the graphic recording of previous and existing conditions, a sector-by-sector architectural survey of each room or space containing surviving plasters and surface finishes was undertaken for Mug House and Cliff Palace and guided by a manual created for the project. Information recorded included masonry construction materials and techniques, with an emphasis on finishes typology, architectural features, and previous stabilization efforts for each area (see appendix 1, pages 64–67). Architectural terminology was developed in conjunction with park archaeologists to refine existing descriptive terms for Mesa Verdean and Puebloan architecture in general. A descriptive survey of architectural information was considered a necessary preface to condition recording for several reasons. First, by describing the architectural materials and construction, features, and repair campaigns for each space by architectural segment, surveyors visually educated themselves about the type, variation, and extent of the architectural fabric before recording the range of symptomatic conditions.3 Second, by observing and recording the variables of location, exposure, materials, construction, and previous repair with respect to condition, critical associations could be established early on that would aid in ultimately understanding the complexities of deterioration mechanisms and patterns. These field data were later manipulated using Access database software to test the role of related factors such as construction technique, exposure, and previous repair on existing condition. Detailed documentation of the architectural context of the surface finishes also assisted archaeologists in better understanding the original and subsequent application, use, and meaning of these finish materials in the context of their own work. 2.1.2 PHOTODOCUMENTATIONTwo hundred fifty individual photographic images were produced of the 10 rooms and 5 kivas at Mug House for the purpose of recording specific details of the conditions of the architectural surface finishes, including plain and painted plasters. An “ideal” image size, or surface area recorded in each photograph, was first determined to allow sufficiently detailed capture of subtle but significant conditions, such as map cracking, for further graphic annotation. This requirement will vary for each project depending on the specific conditions to be recorded, the degree of detail required, and the architectural configuration. At Mesa Verde, a total distance of 121 cm from the wall was established to ensure adequate overlap from one image to the other, accounting for areas of distortion normally occurring around the edges. Plumblines were hung to indicate in each image the determined 66 cm wide sector, while the top and bottom margins were delineated by the tops of walls and the ground surface accordingly, thereby allowing the architectural form to dictate to some degree the vertical dimension of the recording module. Equipment employed included a Pentax 28 mm perspective control “shift” lens mounted on a 35 mm single-lens reflex camera. While larger formats were originally considered in order to obtain what is commonly believed to be a finer image quality, they were found to be cost prohibitive both in the field and in postprocessing when utilizing photo–CD Initially several black-and-white films and a number of lighting scenarios were tested to determine the best approach in obtaining image quality and detail of the various plaster conditions. Kodak TMAX 100 black-and-white film was selected for the enhanced contrast required to accentuate certain surface conditions. One tall and one very small tripod were necessary for all the photodocumentation, not only to stabilize the camera when using the slower film speeds but also to produce consistent results throughout the recording process. Measurements were taken to find the exact center of each sector photographed and to determine the 121 cm distance from the wall. Use of the tripods with bubble levels ensured that the film plane was parallel to the wall each time to eliminate as much distortion as possible. Important to note, however, is that the inherent irregularities of the wall surfaces and curvature of the kiva walls dictated that these photographic images were only marginally rectified or scaleable. This limitation was not disabling, as the primary purpose of the photographs was to provide a background base image for overall dimensions and superimposed graphic annotation of conditions. Experimentation with supplemental lighting consisted of a small flash unit held away from the camera at an angle to produce a small degree of raking light. The high degree of irregularities in the wall surfaces could be either enhanced to show greater surface detail, or exaggerated so as to appear greater than they actually were. Light from the flash, in other words, can produce at least two conditions: the flattening out of some surfaces, effectively erasing the appearance of cracks and bulges, or an exaggeration of cracks and bulges so that they appear more severe than is actually the case. Each sector of wall was then photographed with natural light only and again with raking flash to allow selection of the most accurate or best representation of the surface conditions. On the average, however, only the images produced with the natural light were chosen for printing. A flash (or a slave on occasion) was used to fill in the very darkest areas of an image or to even out images with both dark and light occurring simultaneously. 2.1.3 CONDITION RECORDINGAll field recording of conditions (and eventual treatments) was executed with waterproof colored pens on Mylar overlays on 8 x 10 in. printed photo-images. Direct laptop data entry on-site was not practical due to the harsh environmental conditions, lack of electrical power, and limited budget. Graphic recording systems were developed using color and symbol to define discrete condition types and subtypes within each. Both linear and overall pattern symbols based on standard AutoCAD graphics were employed, depending on the condition category and type (see appendix 1, pages 64–67). For example, subtractive conditions such as loss, detachment, delamination, and cracking were represented with various linear patterns, while additive conditions such as various surface deposits and biogrowth were represented by overall dot patterns. Within general condition types, color and pattern were further refined, linking subtypes together and/or reflecting the different levels of severity within a type. For example, all subtypes of loss were represented in red, and repair campaigns were represented in blue. In other cases, graphic symbols were further refined so that linked subtypes were expressed as variations on a specific pattern such as diagonal hatching and cross-hatching for detachment and delamination and solid and dashed lines for various modes of cracking. In this way, a graphically compatible and easily legible classification system could be created, allowing a fast visual reading both within condition categories (same type) and across condition categories (different types) while at the same time referencing past conditions and previous treatments through complementary graphic overlays and notes. The result is a graphically meaningful and easily legible system based on color and symbol, and 2.2 DIGITAL DOCUMENTATIONAll field-recorded information was subsequently imported into computer photographic and drawing applications to transfer the field survey into a digital format. The final product is a series of plotted vector drawings within the traditional architectural format of scaled elevations and plans but with complex, discrete overlays of annotated conditions, past treatments, and the ability to quantify each condition. These could be produced with or without the raster photo underlays (figs. 5 and 6, see pages 59 and 60). In addition, all current treatments were recorded on the survey for correlation between condition and treatment method and for future evaluation of treatment efficacy.
Three well-known and available graphic and database software programs were selected based on their compatibility, ability to process and analyze the data, and ease of manipulation and retrieval of the data combining graphic, textual, and numeric data. Adobe Photoshop was used to manipulate the CD-ROM raster image, combining and refining the photo elevations of each space. Selected negatives from the 35 mm black-and-white base images used in the field survey were scanned onto a CD-ROM. This process was performed by a commercial photography laboratory producing high-resolution images. Using Adobe Photoshop, the individual sector photographs were manipulated to correct perspective, crop images, and change contrast and sharpness where necessary to produce a good base image for the conditions graphic overlays. All individually entered sectors were then joined to complete each elevation. Joining and rectifying the photographs as a complete montage elevation should always occur first, before detailed sector recording of conditions is attempted, so that anomalies (e.g., misalignment, perspective distortion, or contrast) can be corrected on the base photographs and allow for accurate conditions overlay on the sector photographs at any scale (i.e., individual sector or entire elevation). Drawing programs were used to trace the architectural elements and the conditions. Drawing programs read both raster and vector images and therefore translated the information from raster photographs into vectored drawings. To date, two software programs have been used to import the raster photomontages from Adobe Photoshop into AutoCAD: Spittin' Image (in 1995) and, currently, CADOverlay. Compatibility between software is critical from the onset. Through these programs, architectural elements and surface conditions were traced over the photographs, as was done with the Mylar overlays in the field survey. Depending on site conditions and budget, conditions recording can be done directly in the field on laptop computers. Finally, AutoCAD was used to manipulate the data, assemble all sections, and create architectural drawings to scale. AutoCAD is a graphics software that allows architectural formatting, scaling, and presentation. In this program, the individual sectors were pieced together to form panoramic images or “roll-outs” of the walls of the kivas and individual wall elevations for rooms and open areas. AutoCAD also enabled the display of multiple layers of conditions in any combination simultaneously. The photomontage underneath provided a comprehensive visual representation of the surfaces and spaces, allowing further complex analysis of patterns of deterioration relative to location and orientation within the entire space. Quantification of individual conditions as surface area was performed in AutoCAD and imported into the database program Access. The created database has allowed the quantification of conditions by location and type and will allow future study and tracking of deterioration through time. The field survey data were also transcribed into the database, allowing conservators to test the relationships between condition and deterioration and the variables of original design, materials, construction, exposure, and past interventions. |