STUCCOED TRIPOD VESSELS FROM TEOTIHUAC�N: AN EXAMINATION OF MATERIALS AND MANUFACTUREJessica M. Fletcher
4 EXPERIMENTALOnce the layered structure of stucco decoration was clearly established, analytical techniques were employed to identify the materials used. The results are summarized in tables 2 through 8.
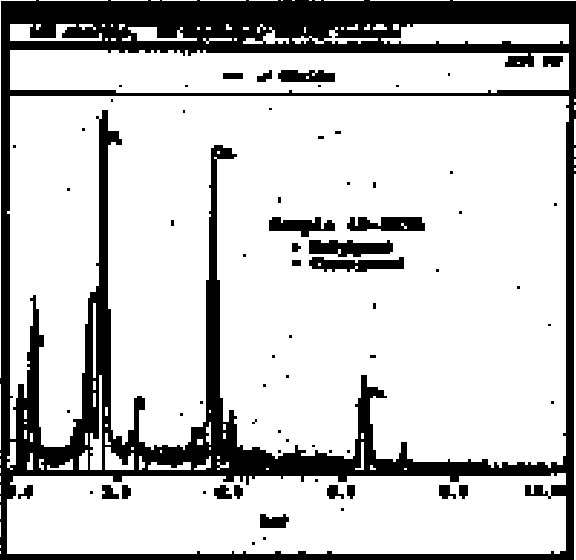
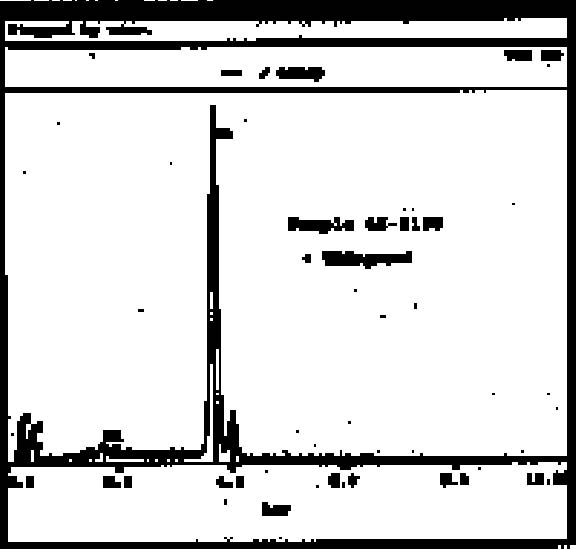
4.1 SAMPLING PROCEDURESamples were taken from the stucco decoration by two methods. For SEM and FTIR, a surgical scalpel was used to cut through all layers of the stucco and remove a small fragment. These samples ranged in size from approximately 0.5 mm to 1.5 mm at the widest point. In all other cases, particular paint and ground layers were isolated. A surgical scalpel was used to remove a small amount of material (smaller than a pinhead) from the surface of the area of interest. 4.2 SCANNING ELECTRON MICROSCOPY4.2.1 TechniqueThirteen samples were examined by SEM/EDX (energy dispersive x-ray spectroscopy) at the South 4.2.2 ResultsCopper-containing green pigments and ironcontaining red and yellow pigments were detected by the scanning electron microscope. From the 13 sherds, 6 samples containing red pigment were examined. All showed a peak for iron (see fig. 5 for representative spectrum). Mercury surprisingly was not detected, indicating the absence of the pigment cinnabar. Literature sources have long associated cinnabar with many ceramic traditions in Mesoamerica, including stuccoed tripod vessels (Conides 1997). The pigment is symbolically connected with burial and the underworld (Taylor 2000) and is less common on other forms of art from Teotihuac�n such as mural paintings, where hematite constitutes the red paint (Conides 1997). This distribution is also logical since the expense of cinnabar would likely limit its use to small areas such as those on ceramics. Examination of the ground layers showed variation in material proportions, but it also indicated a general trend in application. The white top ground layer, when present, seemed to be primarily calcite (see fig. 6 for representative spectrum). In addition to clay inclusions in this layer, the strong peak for silica found in green pigment–containing samples suggested chrysocolla, a copper silicate sometimes associated in nature with malachite and azurite, basic copper carbonates. The composition of the cream ground was not as consistent, with variable proportions of silicate and calcareous material present.
4.3 POLARIZED LIGHT MICROSCOPY4.3.1 TechniqueSince not all examples of pigments were examined by scanning electron microscopy, further investigation was needed to make identifications. 4.3.2 ResultsThe small particle sizes and the high levels of silicate and calcareous material in the samples made their identification by microscopy difficult. Crystals of malachite, azurite, chrysocolla, and the red and yellow iron oxides were easily identified, but many of the smaller particles present could not be positively identified. While all the reds appeared to contain iron oxides, it is possible that there were undetected small amounts of cinnabar present in those samples for which it was not ruled out by scanning electron microscopy. Black paints were examined by polarized light microscopy only. The splintery appearance in all but one of the 11 samples strongly indicated charcoal black as the pigment. Literature sources indicated four likely possibilities: various forms of carbon black (Shepard 1946), manganese black, sphalerite (ZnS), and bitumen (Magaloni et al. 1995). In Castillo Tejero's study (1968), the black is described as a mixture of carbon and clay. Shepard's study indicates a fine carbon black mixed with calcite, as well as charcoal mixed with white clay. The one inconclusive black paint is from one of the sherds (1804) with previous decoration, and it still has not been identified. The pigment is very fine with many agglomerates, but was not characterized further. Manganese is a possibility, as it was detected on SEM spectra for a neighboring red sample. 4.4 MICROCHEMICAL TESTING4.4.1 TechniqueMicrochemical testing was used as a complementary method with polarized light microscopy in this study. Sixty-three samples were taken from the same locations used for polarized light microscopy. Reference samples were created by mixing each likely pigment with calcite and kaolin to approximate the calcium and silicate materials found in the unknown samples. These light-colored materials were added to the pigment until an approximate match to the color of the unknown was achieved. Microchemical tests were then performed on both the reference and unknown pigment samples. Pure kaolin and calcite were used as references when ground materials were tested. The microchemical tests used in this analysis are described in table 9.
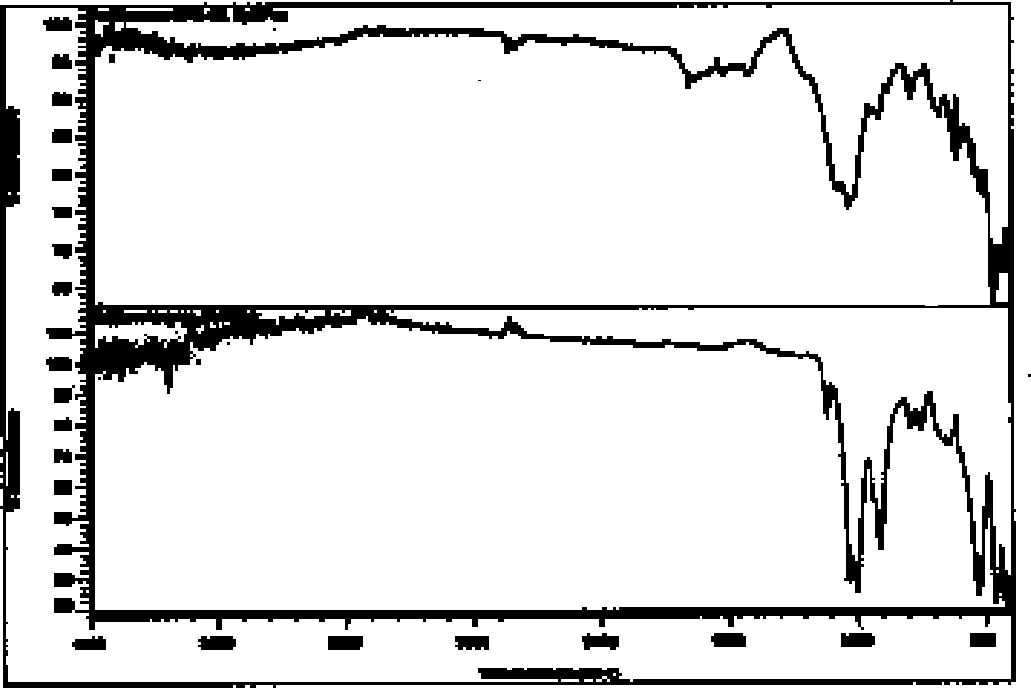
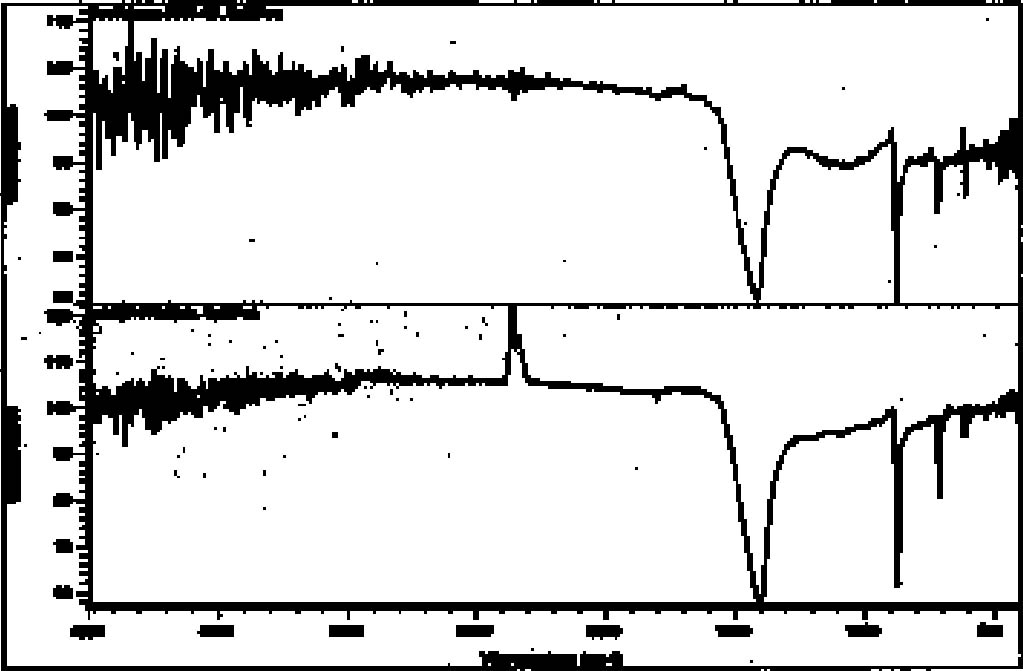
4.4.2 ResultsThe microchemical test for iron was positive in 11 out of 13 red paint samples. In the 2 inconclusive cases, however, the ratio of red pigment to ground material in the sample may have been too small for a positive to be detected. Even the known mixture of iron red and ground gave only a weak positive. The 2 samples that gave inconclusive iron results were further tested with nitric acid to distinguish between hematite, which is unaffected, and cinnabar, which readily dissolves. In both cases, the red pigments appeared unaffected by the treatment, indicating that if cinnabar is present, it is only in very small amounts. During preliminary testing, a positive result for mercury using the reference pigment mixture could not be achieved. The test for mercury was not, therefore, conducted. Again, it is likely that the ratio of red pigment to ground in the sample was insufficient to produce a detectable positive result. The microchemical test for iron in yellow pigments was less conclusive than with red pigments. Five of the 10 samples gave positive tests for iron. Four of the yellow paint samples did not show positive results even though previous analytical methods indicated the presence of yellow iron oxide. The last sample was too small to test. None of the microchemical tests for copper among green and blue-green pigments gave positive results. While frustrating, the result was not totally unexpected since these colors were usually mixed with white ground, making the ratio of pigment to ground even smaller than with the red and yellow pigments. Since previous methods suggested the presence of malachite and azurite, another test was conducted to differentiate between basic copper carbonates and the copper silicate chrysocolla. With the application of hydrochloric acid, malachite and azurite immediately dissolve, while chrysocolla only slowly decolorizes. This testing suggested the presence of chrysocolla in conjunction with malachite in three of the five green samples and in both of the blue samples. The results of the SEM analysis of these samples provided corroborating evidence for the presence of chrysocolla. The SEM results from the grounds also corroborated the results of microchemical testing. When tested with 3 molar hydrochloric acid, calcite-based material immediately dissolved with violent evolution of carbon dioxide gas. Clay-based ground material was unaffected by the acid. While the white calcite layers appeared relatively free of clay, calcite was apparent in small quantities in most of the claybased layers. Red and yellow pigments were detected in both types of ground layers. In fact, in some cases what was presumed to be a clay layer because of its creamy color turned out to be a pigmented calcite layer. In the case of sherd 1804 (with the red-and-black decorative layer beneath the blue-green paint), no distinct ground layer was detectable. Instead, a white material was fairly well impregnated with blue-green pigments. Polarized light microscopy suggested azurite as a component. After treatment with dilute acid (which would dissolve azurite), only yellow and green pigments remained. The white material was identified as calcite. It is likely that the green is chrysocolla and the yellow is an iron oxide. 4.5 X-RAY POWDER DIFFRACTION4.5.1 TechniqueIn order to confirm the specific chemical structure of materials and to clarify samples that were still inconclusive, several samples were examined by XRD. Seven samples were chosen that were deemed representative of pigments and ground layers. After gentle crushing in an agate mortar and pestle, the sample was placed in a 0.3 mm capillary tube, and powder photographs were obtained by the Debye-Scherrer method.2 4.5.2 ResultsDiffraction data were not as conclusive as anticipated. Six of the seven powder photographs suggested mixtures of materials, a problem encountered previously in this research. It was not possible to individually identify the various components within the time limits of this project. The cream ground 4.6 FOURIER TRANSFORM INFRARED SPECTROSCOPY4.6.1 TechniqueSix stuccoed sherds were selected for analysis by FTIR to search for the presence of organic gum binders. New sample locations that contained multiple layers of surface decoration were chosen. It was felt that organic binders, if present, would most likely be encountered in areas with multiple applications. As this was a very general survey, it was not deemed necessary to obtain FTIR spectra on separate layers. The samples were analyzed3 using a Nicolet FTIR equipped with a SplitPea microsample accessory. 4.6.2 ResultsThis analysis did not produce any definitive evidence for the presence of organic binders, but it did help to confirm the previous findings in this study that both silicate and calcareous materials were used for ground composition on the sherds. The spectra recorded for two samples (8772–69 and 8809–71) were not strong enough to be interpreted. The spectra for one sample (8819–72) showed a strong peak for carbonate in the 1450–1410 cm-1 range and a medium peak at 880–860 cm-1, which is consistent with calcite. The spectra recorded for the other three samples (8345–65, 1804–62, and 8819–72) showed peaks in the range associated with silicates, 1100–900 cm-1. While the bands varied in intensity, the strongest peak was seen in all three examples from approximately 1100–950 cm-1 and a weaker peak at 930–900 cm-1. Representative comparisons are made between spectra recorded for Teotihuac�n samples and reference spectra for calcite and kaolin in figures 7 and 8.
|