ABILITY OF TEXTILE COVERS TO PROTECT ARTIFACTS FROM ULTRAVIOLET RADIATIONNANCY KERR, LINDA CAPJACK, & ROBERT FEDOSEJEVS
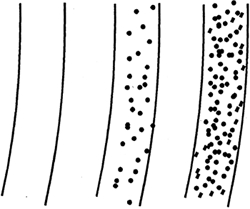
2 2. EXPERIMENTAL2.1 2.1 FABRICSA variety of fabrics, both woven and nonwoven, was selected for this study. Most undyed fabrics were obtained from a commercial source. Woven and knitted fabrics made of 100% cotton, 65/35 polyester/cotton, 50/50 polyester/cotton, and 87/13 nylon spandex were purchased locally. Nonwoven textiles included Cerex spunbonded (SB) nylon, Reemay spunbonded polyester, and Tyvek spunbonded polypropylene. For comparison with the synthetic nonwovens, an acid-free tissue was also included. Fabrics were tested as received from the suppliers. 2.2 2.2 METHODSFabrics were characterized by fiber type, fabric mass, fabric count, thickness, level of delustering, structure, and cover. Fiber type was confirmed through microscopic analysis and chemical solubility tests (American Association of Textile Chemists and Colorists 1996). Fabric structure was identified as woven, knitted, or spunbonded. Canadian General Standards Board test methods (1990) were used to determine fabric weight, the mass per unit area (g/m2), fabric count (the number of yarns/cm or wales and courses/cm), and fabric thickness (Custom Scientific thickness tester [CS-55-225], foot of 28.7 mm diameter, pressure of 1 kPa). Level of delustering was determined qualitatively by examining the appearance of manufactured fibers under a transmitted-light microscope at 400x and estimating the relative amount of pigment in specimens by comparison with photomicrographs in AATCC (1996) Test Method 20–1990 (Fiber Analysis: Qualitative). Fibers classified as bright (B) had little or no titanium dioxide (TiO2). Semidull fibers (S-D) were lightly pigmented (approximately 0.3% by weight TiO2) and dull (D) fibers were highly pigmented (approximately 2% by weight TiO2) (fig. 1). Titanium dioxide is added as a fine white powder to reduce the shine of manufactured fibers (Saunders 1988).
2.2.1 2.2.1 Fabric CoverFabric cover, defined as the percentage of a given fabric area covered by yarns or fibers, was determined by image analysis. A microscope with a 4x objective magnified the fabric, and a video camera resolved the image, which was digitized and then processed by a computer. The video image consisted of 256 x 256 pixels, each having a value between 0 and 255 representing the brightness of that pixel. For each fabric, the illumination was adjusted such that the peak pixel values, corresponding to open areas in the fabric, had an average value of approximately 250. A cutoff intensity value of 125 was used to separate the pixels representing open areas from those representing areas covered by yarns or fibers. The number of pixels falling above and below this cut-off value was determined and then the percentage of covered area was calculated. Reported cover percentages are based on the average of five images per fabric. The choice of an intensity value of 125 to define the edge of the fibers is based on the assumption that the transmission of light through the fibers themselves is negligible, which is not always the case. The interlaced structure of the fibers results in only a fraction of the fibers observed in a given microscope image being in sharp focus with clearly defined edges. Fibers that are out of focus will have blurred edges, making it difficult to precisely determine the edge position. Based on these limitations, the estimated accuracy of the cover measurement was on the order of several percent due to dependence on the choice of the threshold value separating dark from light pixels. 2.2.2 2.2.2 UV TransmissionUV transmission through fabrics selected for the study was measured on a Varian Cary 2415 UV-Vis-NIR spectrophotometer fitted with an integrating sphere to collect forward-scattered and transmitted light. The wavelength range recorded was 280–380 nm, and a monochromator filtered radiation to a 2 nm bandwidth. Fluorescence was eliminated by means of a 3-mm-thick UG-11 fluorescence-blocking filter adapted for the spectrophotometer. From each sample, five random specimens were cut. Each woven specimen had different warp and weft yarns, and each knitted specimen had different lengthwise ribs and crosswise courses. For the UV transmission measurements, four specimens of each fabric were glued on washers with a diameter of 5 cm and a circular opening of 2 cm. The UV transmission was calculated by averaging the measured values over the range of 280–380 nm. Davis (1995) determined that normally four specimens per sample must be scanned to ensure that the estimated mean UV transmission of the sample will have a standard error no greater than 5% of the mean. |