LEAD-ALKALINE GLAZED EGYPTIAN FAIENCE: PRELIMINARY TECHNICAL INVESTIGATION OF PTOLEMAIC PERIOD FAIENCE VESSELS IN THE COLLECTION OF THE WALTERS ART GALLERYYUNHUI MAO
3 3. RESULTS AND DISCUSSION3.1 3.1 STEREOMICROSCOPYBroken edges of vessel fragments and vessels with minor breakage and losses were examined under the microscope. All pieces exhibit a layered structure, which is composed of a body, an underglaze, and a glaze layer. The body appears to be white or pale yellow (see table 2) and is very fine textured. In some cases the body contains small, bubblelike holes in the broken edges, indicating trapped air bubbles. The underglaze is present only at localized recessed areas to reveal surface designs. It appears to be thick and is opaque. The underglaze was probably applied as a layer of slurry overall, then wiped off from raised areas, leaving it collected in the recesses. It would be very time-consuming to fill each individual recess of a complex and detailed surface design. The glaze is present overall on both the interior and the exterior. It appears to be thin and transparent. Drip marks are observed in the interior of some of the vessel fragments and vessels, indicating that the overall glaze is applied. The glaze is weathered and exhibits a fine network of cracks. It is abraded and worn, particularly in the raised areas. The underglaze and the glaze can be easily distinguished visually by the contrasting color hues used (see table 2). In general, the underglaze is greenish blue to blue, and the glaze is pale yellow to light green. The underglaze has a stronger and darker color than the glaze, thus emphasizing the design (see figs. 2, 3). The underglaze is also thicker than the glaze (see table 2). In addition to its usual colors, yellow is used as an accent for the underglaze in two cases (acc. nos. 48.367 and 48.379). The yellow underglaze is present only on the raised dot decorations. The examination of a half-broken dot indicated that the raised dots were probably created in the mold rather than applied after molding. The dots have the same body material underneath the yellow underglaze. 3.2 3.2 XERORADIOGRAPHYXeroradiography contributed to the understanding of the forming and the construction process. All pieces appear to be made from a mold or from piece molds. Neither circular lines associated with wheel-turning nor specific orientation of any particles was observed. The interiors of enclosed vessels, such as jars, are not as smooth as the exteriors, thus further suggesting the pressing of an object against a mold. In many cases, the xeroradiograph revealed numerous round or oval-shaped holes in the bodies. The holes are probably associated with air bubbles produced during the kneading of the body material. The trapped air bubbles (up to 2 x 3 mm) in the body indicated that the body was not very plastic and was hard to manipulate (fig. 4).
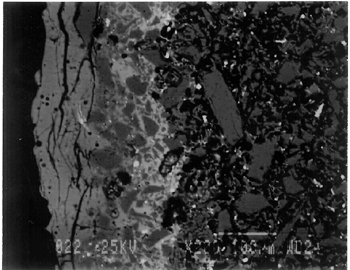
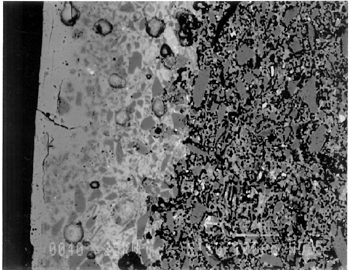
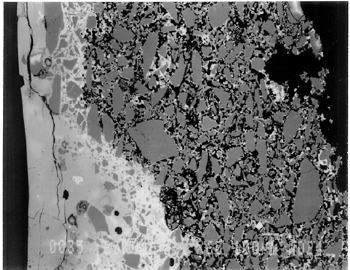
Joints were observed in the xeroradiograph, which confirmed that piece molds were used for making objects with complex shapes or large size. The rhyton (see fig. 2), tall jars with narrow openings, and bowls with both interior and exterior relief decorations are examples of the use of piece molds. After the piece was taken out of the mold, the final details and designs were enhanced through carving and/or incisions. 3.3 3.3 ENERGY DISPERSIVE X-RAY FLUORESCENCE (ED-XRF)In most of the pieces analyzed, lead, copper, iron, calcium, and antimony were detected qualitatively by ED-XRF in the surfaces of both the glaze and the underglaze. However, a tile, acc. no. 48.1664, was alkaline glazed. Being an exception, it was excluded from the study. All the remaining 20 pieces consistently exhibited an intense lead peak in the ED-XRF spectra. This finding led to questions about the faience glaze: Was the glaze a pure lead-silica glaze or an alkaline glaze containing lead? For the eventual selection of fragments for further analyses, the 20 pieces were divided into two groups based on the varied amounts of copper and iron present in the glaze and the underglaze layer. In one group of 14, the glaze layer contained more copper than the underglaze; in the other group of 6, the glaze layer contained more iron than the underglaze. 3.4 3.4 SCANNING ELECTRON MICROSCOPY (SEM)3.4.1 3.4.1 ExaminationBased on the ED-XRF results and stylistic diagnosis, five representative pieces (acc. nos. 48.376, 48.377, 48.379, 48.380, and 48.386) were selected (see fig. 3) for in-depth SEM analysis, with one additional sample taken from a raised dot area of a bowl (acc. no. 48.367) to determine the yellow colorant. All polished sections of the samples were examined under the reflected light of a polarized microscope (100x). The thickness of the glaze layer, the underglaze layer, and the body were defined. Munsell soil color and Munsell color charts were used for determining the colors of each layer. The lighting conditions used for all color readings were to simulate daylight generated by a lamp, which combined both incandescent and fluorescent bulbs. The color choices of green, blue-green, and yellow in glazes were highly fashionable in the Ptolemaic period, as opposed to the predominantly turquoise blue used previously. 3.4.2 3.4.2 SEM-WDS ResultsThe analyses of the glaze layer were carried out in an area where glaze alone is present or in the glassy areas, to avoid the underglaze. For example, the glaze analysis of acc. no. 48.379 was carried out on the exterior where only glaze is present (fig. 5), and the glaze analysis of acc. no. 48.380 was done in the glassy matrix of the glaze layer (fig. 6). Obvious cracks and voids were also avoided when selecting analytical sites; however, the presence of extensive microcracking throughout the weathered surface of the glaze layer meant that ideal areas for glaze analysis do not exist. The analyses of the underglaze layer were carried out in the glassy matrix visible on the back-scattered electron images (figs. 6–7) as a white dense band away from the glaze layer. SEM-WDS analyses (in oxide wt%) of the glaze layer reveal that the major oxide in the glaze is silica (SiO2), ranging from 68% to 78%. A considerable amount of lead was identified in the glaze layer, with lead oxide (PbO) ranging from 2.4% to 11.1%. The alkali content, combining sodium oxide (Na2O) and potassium oxide (K2O), is below 1%. The chloride content is somewhat high, ranging from 1.2% to 2.5%, a finding that often suggests the glaze surface has been weathered (Freestone 1998).
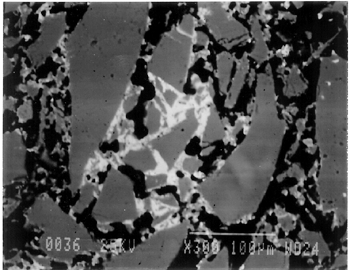
The solubility of chlorine in the alkaline glaze depends upon the amount of sodium present in the glaze. At about 15% Na2O, the solubility of chlorine is about 1.3%, which is about the maximum amount of chlorine that is found in unweathered alkaline glazes and glasses (Barber and Freestone 1990). When the surface of the glaze is weathered away, some of its components still remain, and chlorine content could actually be increased (Freestone et al. 1985). Also, the weathered areas of the glaze can easily absorb chloride salts in the groundwater during burial, thus increasing chloride content when analyzed. Sometimes the chloride in the weathered glaze can be identified as copper chloride inclusions or other more complex salts (Freestone 1998). In this study, the weathered glaze surface is also confirmed by the microscopic examination through a fine network of cracks and heavy abrasion on the glaze surface. As a result, the glaze has been depleted in alkali, leaving a lead-enriched surface. SEM-WDS analyses of the underglaze layer indicate that its composition is similar to that of the glaze but different in alkali content. The underglaze is relatively less weathered than the glaze layer. The alkali content is significantly increased, with Na2O and K2O ranging from 4.7% to 11.9%, and the chloride content between 0.3% to 1.3%, much lower than that of the glaze layer. The percent totals in the glaze layers are low, ranging from 84.4% to 93.2%. This finding is probably due to a topography problem of the weathered glaze layers, which exhibit many voids and microcracks (Freestone 1982). The surface is so weathered overall that, even with a small beam size of 10 x 10 μm, it is impossible to avoid them during analysis. Also, the samples were polished using Micro-meshes up to 6,000 grit. This polishing regime may not have been fine enough, thus contributing to the low totals (Gabriel 1985). Similar elements were found in both the glaze and the underglaze in the SEM-WDS analyses. The difference between them appears to be limited to the concentrations of colorants present. As a result, two distinctively colored glaze layers were produced. The analytical data are supported and confirmed by visual examination. Copper, iron, cobalt, antimony, and manganese were likely used as colorants to achieve a range of green and blue colors. In general, the concentration of antimony is greater in the glaze layer (0.03–0.3%) than that of the underglaze layer (below detection limit to 0.03%), with a varied amount of copper, producing pale yellow to light green on the overall glaze layer. The concentrations of iron and cobalt are much greater in the underglaze, producing blue in the underglaze. The concentration of manganese varies from sample to sample. The glaze analyses of acc. nos. 48.377 and 48.379 were carried out where only a glaze layer is present. The cobalt concentration of the glaze (0.1–0.2%) is much less than that of the underglaze layer (0.5–1.0%). In contrast, the concentrations of cobalt detected in the glaze of acc. nos. 48.376, 48.380, and 48.386 are similar to those found in the underglazes. Since both layers of glazes penetrated simultaneously into the body upon firing, interdiffusion of colorants between the glaze and the underglaze is likely to have occurred. Therefore, the cobalt concentrations in the glaze layers of these three samples are not reliable. Observed cobalt concentration differs from added cobalt concentration. The concentration of cobalt detected in the underglaze (0.8–1.5%) is much higher than the amount detected in faience of earlier periods, up to 0.5% (Shortland and Tite 1998). To evaluate the accuracy of the cobalt analyses, a glass standard, 734XH, with 1.11% of cobalt oxide, was obtained from Corning Incorporated to analyze the cobalt concentration in the underglaze again. The cobalt compositions determined with the new standard were within the ranges found previously in table 3. The high concentration of cobalt in the underglaze can be explained by its preparation. To reveal the surface design through a colored glaze layer, the underglaze has to be darker. The underglaze may have been prepared as a “raw pigment,” quite concentrated in cobalt, to “paint the design” on the surface. A parallel example was found in a Roman Period faience bowl reported colored by about 1% cobalt oxide (CoO) (Kaczmarczyk and Hedges 1983, 53). Future analyses of more samples of Ptolemaic faience are needed to support the high concentration of cobalt observed in the underglaze. SEM-WDS analysis on the yellow raised dot suggests that lead antimonate (Pb2Sb2O7) was most likely to have been used as the yellow colorant. The amount of antimony oxide (Sb2O5) detected in the yellow area was 0.7%, a large amount indicating its deliberate use with lead as a yellow colorant, as opposed to being used as a decolorant of less than 0.2% of Sb2O5 (Kaczmarczyk and Hedges 1983, 98–101). 3.4.3 3.4.3 SEM-EDS ResultsSEM-EDS results, given in table 4, indicated that the bodies of all samples consist chiefly of quartz (SiO2), ranging from 88–94%. A small amount of the glazing material, containing lead, sodium, and potassium, appears to be deliberately mixed with the siliceous body, presumably to improve the fusion of the body components during firing. The quantitative composition of the interstitial glaze material has not been analyzed. Trace amounts of alumina were also detected within a range of 0.4–1.7%. The small amount of alumina present does not appear to have been added to increase the plasticity of the body but is a by-product of other constituents. It could come from the glazing material. In some cases, lead antimonate particles were suggested by SEM-EDS. The small amount of lead antimonate and iron oxide that are present in the quartz body contribute the yellowish appearance of the body. The amount of antimony present is less than 0.7%, not significant enough to affect the fusion of body components. As seen in back-scattered electron images (figs. 5–8), the body is heterogeneous. The majority of the gray areas are crystalline quartz, about 20–100 μm in size. Their extreme fineness enabled the transfer of the sharp design from the mold. The quartz body is mixed with interstitial glaze material seen in white spots (see fig. 8) to produce fusion of quartz grains during firing.
The thickness of each layer is reported in table 2, and a distinguishable boundary between the glaze and the underglaze was established on the back-scattered electron images. The lead-alkali glaze appears to have penetrated into the quartz body during firing. This finding is evident in the slightly dense glaze-body interaction layer, which appears as a white band in the back-scattered electron image (see fig. 5). The glaze layer area appears less dense as surface weathering leached out alkalis. The weathering is also seen as cracks and pitting. The glaze layer appears homogeneous in all three back-scattered electron images (see figs. 5–7). The penetration of lead-alkali glaze into a ceramic substrate is not unique to Ptolemaic faience; it has been noted in Iznik tiles (Kingery and Vandiver 1986, 129). It is important to note that the invasion of the glaze into the body (see fig. 5) due to the low viscosity of molten lead-alkali glaze should not be confused with the efflorescence glazed process of alkali glaze. Judging from the back-scattered electron images of the efflorescence process of alkali glaze (Tite and Bimson 1986), the efflorescence of pharaonic faience and the application process of lead-alkali glaze of Ptolemaic faience have a similar appearance. They both have a glaze-body interaction layer. However, the different glaze ingredient distinguishes them. The underglaze appears to be dense, seen as a white band, since it is not as weathered and contains more alkali (see figs. 6, 7). Since both the glaze and the underglaze have similar chemical compositions, interdiffusion of the two layers is likely. The underglaze appears to be a slurry mixture of glaze material and quartz particles. The quartz particles in the underglaze appear to be finer than that in the body. 3.4.4 3.4.4. Firing TemperatureAccording to the literature (Kingery and Vandiver 1986), ancient quartz-paste ware was predominantly made in a one-fire process. Theoretically, lead-alkaline glaze would provide a lower melting temperature than that of alkaline glaze. Within limits, the higher the lead content is, the lower its melting temperature would be (Nordyke 1984). This finding makes it possible that Ptolemaic faience may have been fired at a lower temperature than that of pharaonic faience. |